|
1800
|
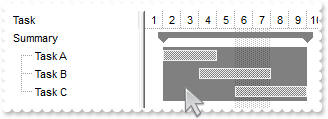
How can I highlight somehow the child bars of a summary bar
With G2antt1
	.BeginUpdate
	.Columns.Add "Task"
	With .Chart
		.PaneWidth(False) = 128
		.FirstVisibleDate = #1/1/2001#
		.Bars.Item("Task").Color = RGB(240,240,240)
	End With
	With .Items
		hSummary = .AddItem("Summary")
		.AddBar hSummary,"Project Summary",#1/2/2001#,#1/2/2001#,""
		hTask = .InsertItem(hSummary,,"Task A")
		.AddBar hTask,"Task",#1/2/2001#,#1/5/2001#,"K1"
		hTask = .InsertItem(hSummary,,"Task B")
		.AddBar hTask,"Task",#1/4/2001#,#1/8/2001#,"K2"
		hTask = .InsertItem(hSummary,,"Task C")
		.AddBar hTask,"Task",#1/6/2001#,#1/10/2001#,"K3"
		.ExpandItem(hSummary) = True
		.DefineSummaryBars hSummary,"",-1,"<*>"
		.ItemBar(hSummary,"",34) = 65536
		.ItemBar(hSummary,"",35) = 50
	End With
	.EndUpdate
End With
|
|
1799
|
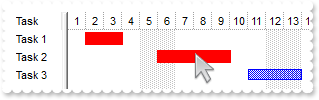
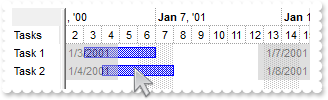
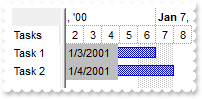
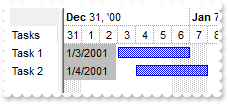
How do I change the color for the selected bars, without showing the frame arround
With G2antt1
	.BeginUpdate
	With .Chart
		.FirstVisibleDate = #1/1/2002#
		.SelBarColor = &H7f0000ff
		.PaneWidth(0) = 48
	End With
	.Columns.Add "Task"
	With .Items
		.AddBar .AddItem("Task 1"),"Task",#1/2/2002#,#1/4/2002#,"A"
		.AddBar .AddItem("Task 2"),"Task",#1/6/2002#,#1/10/2002#,"B"
		.AddBar .AddItem("Task 3"),"Task",#1/11/2002#,#1/14/2002#,"C"
		.ItemBar(0,"<A B>",257) = True
	End With
	.EndUpdate
End With
|
|
1798
|
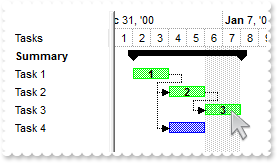
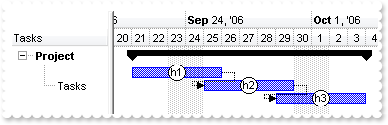
Is it possible to enumerate the activities/bars of critical path
' BarResize event - Occurs when a bar is moved or resized.
Private Sub G2antt1_BarResize(ByVal Item As Long, ByVal Key As Variant)
	With G2antt1
		.Items.SchedulePDM Item,Key
	End With
End Sub

With G2antt1
	.BeginUpdate
	.Columns.Add "Tasks"
	With .Chart
		.LevelCount = 2
		.FirstVisibleDate = #1/1/2001#
		.PaneWidth(False) = 96
		.Bars.Item("Task").Def(3) = "<%=int(%269) > 0 ? (`<b>` + %269 + `</b>`) : ``%>"
	End With
	With .Items
		hSummary1 = .AddItem("Summary")
		.ItemBold(hSummary1) = True
		.AddBar hSummary1,"Summary",#1/2/2001#,#1/2/2001#,"sum"
		h1 = .AddItem("Task 1")
		.AddBar h1,"Task",#1/2/2001#,#1/4/2001#
		.DefineSummaryBars hSummary1,"sum",h1,""
		h2 = .AddItem("Task 2")
		.AddBar h2,"Task",#1/2/2001#,#1/4/2001#
		.DefineSummaryBars hSummary1,"sum",h2,""
		.AddLink "L1",h1,"",h2,""
		h3 = .AddItem("Task 3")
		.AddBar h3,"Task",#1/2/2001#,#1/4/2001#
		.DefineSummaryBars hSummary1,"sum",h3,""
		.AddLink "L2",h2,"",h3,""
		h4 = .AddItem("Task 4")
		.AddBar h4,"Task",#1/2/2001#,#1/4/2001#
		.DefineSummaryBars hSummary1,"sum",h4,""
		.AddLink "L3",h1,"",h4,""
		.DefSchedulePDM(5) = 65280
		.SchedulePDM h1,""
	End With
	.EndUpdate
End With
|
|
1797
|
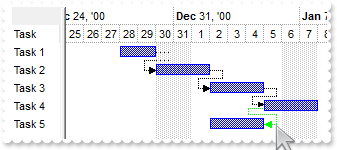
How can I add a SF link
With G2antt1
	.BeginUpdate
	.Columns.Add "Task"
	With .Chart
		.FirstVisibleDate = #12/25/2000#
		.PaneWidth(False) = 48
		.LevelCount = 2
	End With
	With .Items
		h1 = .AddItem("Task 1")
		.AddBar h1,"Task",#1/2/2001#,#1/4/2001#,"K1"
		h2 = .AddItem("Task 2")
		.AddBar h2,"Task",#1/2/2001#,#1/5/2001#,"K2"
		h3 = .AddItem("Task 3")
		.AddBar h3,"Task",#1/2/2001#,#1/5/2001#,"K3"
		h4 = .AddItem("Task 4")
		.AddBar h4,"Task",#1/2/2001#,#1/5/2001#,"K4"
		h5 = .AddItem("Task 5")
		.AddBar h5,"Task",#1/2/2001#,#1/5/2001#,"K5"
		.AddLink "L1",h1,"K1",h2,"K2"
		.AddLink "L2",h2,"K2",h3,"K3"
		.AddLink "L3",h3,"K3",h4,"K4"
		.AddLink "L4",h4,"K4",h5,"K5"
		.Link("L4",6) = 0
		.Link("L4",7) = 2
		.Link("L4",8) = 65280
		.SchedulePDM 0,"K5"
	End With
	.Chart.ShowLinks = 1
	.EndUpdate
End With
|
|
1796
|
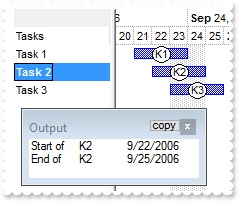
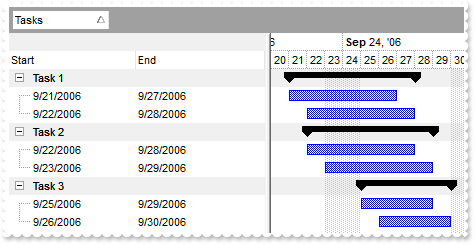
How do I get the Start and End date of a bar
With G2antt1
	.BeginUpdate
	.Columns.Add "Tasks"
	.Debug = True
	With .Chart
		.FirstVisibleDate = #9/20/2006#
		.LevelCount = 2
		.PaneWidth(0) = 96
	End With
	With .Items
		.AddBar .AddItem("Task 1"),"Task",#9/21/2006#,#9/24/2006#,"K1"
		.AddBar .AddItem("Task 2"),"Task",#9/22/2006#,#9/25/2006#,"K2"
		.AddBar .AddItem("Task 3"),"Task",#9/23/2006#,#9/26/2006#,"K3"
		h = .ItemByIndex(1)
		.ItemBold(h) = True
		Debug.Print( "Start of " )
		Debug.Print( .FirstItemBar(h) )
		Debug.Print( .ItemBar(h,.FirstItemBar(h),1) )
		Debug.Print( "End of  " )
		Debug.Print( .FirstItemBar(h) )
		Debug.Print( .ItemBar(h,.FirstItemBar(h),2) )
	End With
	.EndUpdate
End With
|
|
1795
|
I haven't found options to change/localize (in German, or my current regional settings) the captions/text/strings ( dates, tooltip ) that shows in the chart area (method 2)
With G2antt1
	With .Chart
		.FirstWeekDay = .LocFirstWeekDay ' .LocFirstWeekDay
		.MonthNames = .LocMonthNames
		.WeekDays = .LocWeekDays
		.AMPM = .LocAMPM
		.LevelCount = 2
		.PaneWidth(False) = 0
		.UnitScale = 4096
	End With
End With
|
|
1794
|
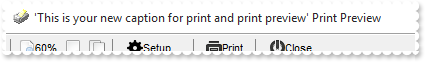
Is it possible to change caption of the print and print preview, as it just says "Untitled Document", but I cant find the code that writes this caption
With G2antt1
	.BeginUpdate
	.Columns.Add "Task"
	.Chart.FirstVisibleDate = #1/1/2001#
	With .Items
		h1 = .AddItem("Task 1")
		.AddBar h1,"Task",#1/2/2001#,#1/4/2001#,"K1"
		h2 = .AddItem("Task 2")
		.AddBar h2,"Task",#1/5/2001#,#1/7/2001#,"K2"
		.AddLink "L1",h1,"K1",h2,"K2"
	End With
	.EndUpdate
	With CreateObject("Exontrol.Print")
		.Caption = "This is your new caption for print and print preview"
		.AutoRelease = False
		.PrintExt = G2antt1.Object
		.Preview
	End With
End With
|
|
1793
|
Is it possible to specify the A4 paper size for the print preview
With G2antt1
	.BeginUpdate
	.Columns.Add "Task"
	.Chart.FirstVisibleDate = #1/1/2001#
	With .Items
		h1 = .AddItem("Task 1")
		.AddBar h1,"Task",#1/2/2001#,#1/4/2001#,"K1"
		h2 = .AddItem("Task 2")
		.AddBar h2,"Task",#1/5/2001#,#1/7/2001#,"K2"
		.AddLink "L1",h1,"K1",h2,"K2"
	End With
	.EndUpdate
	With CreateObject("Exontrol.Print")
		.Settings(0) = 9
		.AutoRelease = False
		.PrintExt = G2antt1.Object
		.Preview
	End With
End With
|
|
1792
|
Is it possible to tell the print preview to open up in "landscape mode" by default, not in "portrait mode"
With G2antt1
	.BeginUpdate
	.Columns.Add "Task"
	.Chart.FirstVisibleDate = #1/1/2001#
	With .Items
		h1 = .AddItem("Task 1")
		.AddBar h1,"Task",#1/2/2001#,#1/4/2001#,"K1"
		h2 = .AddItem("Task 2")
		.AddBar h2,"Task",#1/5/2001#,#1/7/2001#,"K2"
		.AddLink "L1",h1,"K1",h2,"K2"
	End With
	.EndUpdate
	With CreateObject("Exontrol.Print")
		.PageOrientation = 2
		.AutoRelease = False
		.PrintExt = G2antt1.Object
		.Preview
	End With
End With
|
|
1791
|
How do I prevent a caption outside the bar from overlapping other bars
With G2antt1
	.BeginUpdate
	.ScrollBySingleLine = True
	.Columns.Add "Task"
	With .Chart
		.FirstVisibleDate = #1/1/2001#
		.PaneWidth(False) = 48
		.Bars.Copy "Task","Default-Task"
		.Bars.Item("Task").OverlaidType = 4611 ' OverlaidBarsTypeEnum.exOverlaidBarsIncludeCaption Or OverlaidBarsTypeEnum.exOverlaidBarsStackAutoArrange Or OverlaidBarsTypeEnum.exOverlaidBarsStack
	End With
	With .Items
		h = .AddItem("Task 1")
		.AddBar h,"Task",#1/2/2001#,#1/4/2001#,"A1","task"
		.ItemBar(h,"A1",4) = 18
		.AddBar h,"Task",#1/6/2001#,#1/10/2001#,"A2","task"
		.ItemBar(h,"A2",4) = 16
		h = .AddItem("Task 2")
		.AddBar h,"Default-Task",#1/2/2001#,#1/4/2001#,"A1","task"
		.ItemBar(h,"A1",4) = 18
		.AddBar h,"Default-Task",#1/6/2001#,#1/10/2001#,"A2","task"
		.ItemBar(h,"A2",4) = 16
	End With
	.EndUpdate
End With
|
|
1790
|
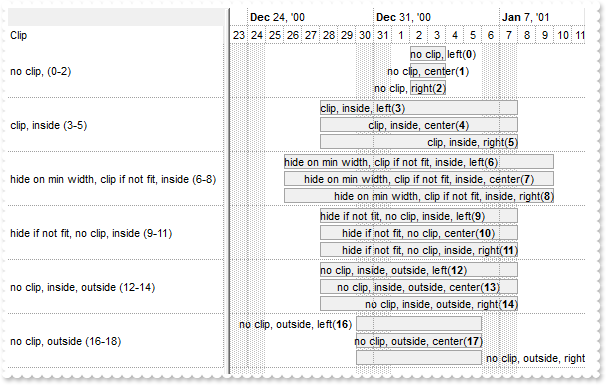
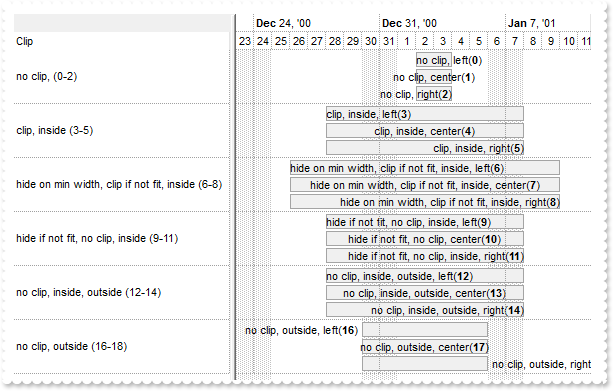
How do I clip/hide/align the bar's extra-caption/text based on the bar's size/width/length
With G2antt1
	.BeginUpdate
	.Columns.Add "Clip"
	.ScrollBySingleLine = True
	.DrawGridLines = -2
	With .Chart
		.AllowResizeChart = 6 ' ResizeChartEnum.exAllowResizeChartMiddle Or ResizeChartEnum.exAllowResizeChartHeader
		.DrawGridLines = -2
		.FirstVisibleDate = #12/23/2000#
		.LevelCount = 2
		.PaneWidth(False) = 216
		With .Bars.Item("Task")
			.Pattern = 32
			.Color = RGB(164,164,164)
			.StartColor = RGB(240,240,240)
			.EndColor = .StartColor
			.OverlaidType = 4611 ' OverlaidBarsTypeEnum.exOverlaidBarsIncludeCaption Or OverlaidBarsTypeEnum.exOverlaidBarsStackAutoArrange Or OverlaidBarsTypeEnum.exOverlaidBarsStack
			.Height = 15
		End With
		.MinUnitWidth = .UnitWidth
	End With
	With .Items
		h = .AddItem("no clip, (0-2)")
		.AddBar h,"Task",#1/2/2001#,#1/4/2001#,"K1"
		.ItemBar(h,"K1",44) = "no clip, right(<b>2</b>)"
		.ItemBar(h,"K1",45) = 2
		.AddBar h,"Task",#1/2/2001#,#1/4/2001#,"K2"
		.ItemBar(h,"K2",44) = "no clip, center(<b>1</b>)"
		.ItemBar(h,"K2",45) = 1
		.AddBar h,"Task",#1/2/2001#,#1/4/2001#,"K3",""
		.ItemBar(h,"K3",44) = "no clip, left(<b>0</b>)"
		.ItemBar(h,"K3",45) = 0
		h = .AddItem("clip, inside (3-5)")
		.AddBar h,"Task",#12/28/2000#,#1/8/2001#,"K1"
		.ItemBar(h,"K1",44) = "clip, inside, right(<b>5</b>)"
		.ItemBar(h,"K1",45) = 5
		.AddBar h,"Task",#12/28/2000#,#1/8/2001#,"K2"
		.ItemBar(h,"K2",44) = "clip, inside, center(<b>4</b>)"
		.ItemBar(h,"K2",45) = 4
		.AddBar h,"Task",#12/28/2000#,#1/8/2001#,"K3"
		.ItemBar(h,"K3",44) = "clip, inside, left(<b>3</b>)"
		.ItemBar(h,"K3",45) = 3
		h = .AddItem("hide on min width, clip if not fit, inside (6-8)")
		.AddBar h,"Task",#12/26/2000#,#1/10/2001#,"K1"
		.ItemBar(h,"K1",44) = "hide on min width, clip if not fit, inside, right(<b>8</b>)"
		.ItemBar(h,"K1",45) = 8
		.AddBar h,"Task",#12/26/2000#,#1/10/2001#,"K2"
		.ItemBar(h,"K2",44) = "hide on min width, clip if not fit, inside, center(<b>7</b>)"
		.ItemBar(h,"K2",45) = 7
		.AddBar h,"Task",#12/26/2000#,#1/10/2001#,"K3"
		.ItemBar(h,"K3",44) = "hide on min width, clip if not fit, inside, left(<b>6</b>)"
		.ItemBar(h,"K3",45) = 6
		h = .AddItem("hide if not fit, no clip, inside (9-11)")
		.AddBar h,"Task",#12/28/2000#,#1/8/2001#,"K1"
		.ItemBar(h,"K1",44) = "hide if not fit, no clip, inside, right(<b>11</b>)"
		.ItemBar(h,"K1",45) = 11
		.AddBar h,"Task",#12/28/2000#,#1/8/2001#,"K2"
		.ItemBar(h,"K2",44) = "hide if not fit, no clip, center(<b>10</b>)"
		.ItemBar(h,"K2",45) = 10
		.AddBar h,"Task",#12/28/2000#,#1/8/2001#,"K3"
		.ItemBar(h,"K3",44) = "hide if not fit, no clip, inside, left(<b>9</b>)"
		.ItemBar(h,"K3",45) = 9
		h = .AddItem("no clip, inside, outside (12-14)")
		.AddBar h,"Task",#12/28/2000#,#1/8/2001#,"K1"
		.ItemBar(h,"K1",44) = "no clip, inside, outside, right(<b>14</b>)"
		.ItemBar(h,"K1",45) = 14
		.AddBar h,"Task",#12/28/2000#,#1/8/2001#,"K2"
		.ItemBar(h,"K2",44) = "no clip, inside, outside, center(<b>13</b>)"
		.ItemBar(h,"K2",45) = 13
		.AddBar h,"Task",#12/28/2000#,#1/8/2001#,"K3"
		.ItemBar(h,"K3",44) = "no clip, inside, outside, left(<b>12</b>)"
		.ItemBar(h,"K3",45) = 12
		h = .AddItem("no clip, outside (16-18)")
		.AddBar h,"Task",#12/30/2000#,#1/6/2001#,"K1"
		.ItemBar(h,"K1",44) = "no clip, outside, right(<b>18</b>)"
		.ItemBar(h,"K1",45) = 18
		.AddBar h,"Task",#12/30/2000#,#1/6/2001#,"K2"
		.ItemBar(h,"K2",44) = "no clip, outside, center(<b>17</b>)"
		.ItemBar(h,"K2",45) = 17
		.AddBar h,"Task",#12/30/2000#,#1/6/2001#,"K3"
		.ItemBar(h,"K3",44) = "no clip, outside, left(<b>16</b>)"
		.ItemBar(h,"K3",45) = 16
	End With
	.EndUpdate
End With
|
|
1789
|
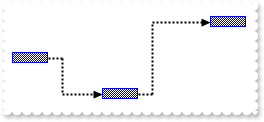
What options do I have to show the links between bars (rectangular SEV, starts vertically, ends vertically)
With G2antt1
	.BeginUpdate
	.AntiAliasing = True
	.Columns.Add "Task"
	With .Chart
		.FirstVisibleDate = #1/1/2001#
		.PaneWidth(False) = 128
		.NonworkingDays = 0
		.LinksWidth = 2
	End With
	With .Items
		.AddItem ""
		h3 = .AddItem("Task 3")
		.AddItem ""
		.AddBar h3,"Task",#1/13/2001#,#1/15/2001#,"K3"
		h1 = .AddItem("Task 1")
		.AddItem ""
		.AddBar h1,"Task",#1/2/2001#,#1/4/2001#,"K1"
		h2 = .AddItem("Task 2")
		.AddBar h2,"Task",#1/7/2001#,#1/9/2001#,"K2"
		.AddItem ""
		.AddLink "L1",h1,"K1",h2,"K2"
		.AddLink "L2",h2,"K2",h3,"K3"
		.Link("<*>",15) = 5
	End With
	.EndUpdate
End With
|
|
1788
|
What options do I have to show the links between bars (rectangular SV, starts vertically, ends horizontally)
With G2antt1
	.BeginUpdate
	.AntiAliasing = True
	.Columns.Add "Task"
	With .Chart
		.FirstVisibleDate = #1/1/2001#
		.PaneWidth(False) = 128
		.NonworkingDays = 0
		.LinksWidth = 2
	End With
	With .Items
		.AddItem ""
		h3 = .AddItem("Task 3")
		.AddItem ""
		.AddBar h3,"Task",#1/13/2001#,#1/15/2001#,"K3"
		h1 = .AddItem("Task 1")
		.AddItem ""
		.AddBar h1,"Task",#1/2/2001#,#1/4/2001#,"K1"
		h2 = .AddItem("Task 2")
		.AddBar h2,"Task",#1/7/2001#,#1/9/2001#,"K2"
		.AddItem ""
		.AddLink "L1",h1,"K1",h2,"K2"
		.AddLink "L2",h2,"K2",h3,"K3"
		.Link("<*>",15) = 4
	End With
	.EndUpdate
End With
|
|
1787
|
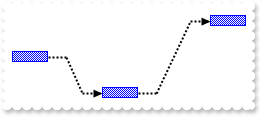
What options do I have to show the links between bars (rectangular EV, starts horizontally, ends vertically)
With G2antt1
	.BeginUpdate
	.AntiAliasing = True
	.Columns.Add "Task"
	With .Chart
		.FirstVisibleDate = #1/1/2001#
		.PaneWidth(False) = 128
		.NonworkingDays = 0
		.LinksWidth = 2
	End With
	With .Items
		.AddItem ""
		h3 = .AddItem("Task 3")
		.AddItem ""
		.AddBar h3,"Task",#1/13/2001#,#1/15/2001#,"K3"
		h1 = .AddItem("Task 1")
		.AddItem ""
		.AddBar h1,"Task",#1/2/2001#,#1/4/2001#,"K1"
		h2 = .AddItem("Task 2")
		.AddBar h2,"Task",#1/7/2001#,#1/9/2001#,"K2"
		.AddItem ""
		.AddLink "L1",h1,"K1",h2,"K2"
		.AddLink "L2",h2,"K2",h3,"K3"
		.Link("<*>",15) = 3
	End With
	.EndUpdate
End With
|
|
1786
|
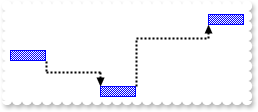
What options do I have to show the links between bars (straight)
With G2antt1
	.BeginUpdate
	.AntiAliasing = True
	.Columns.Add "Task"
	With .Chart
		.FirstVisibleDate = #1/1/2001#
		.PaneWidth(False) = 128
		.NonworkingDays = 0
		.LinksWidth = 2
	End With
	With .Items
		.AddItem ""
		h3 = .AddItem("Task 3")
		.AddItem ""
		.AddBar h3,"Task",#1/13/2001#,#1/15/2001#,"K3"
		h1 = .AddItem("Task 1")
		.AddItem ""
		.AddBar h1,"Task",#1/2/2001#,#1/4/2001#,"K1"
		h2 = .AddItem("Task 2")
		.AddBar h2,"Task",#1/7/2001#,#1/9/2001#,"K2"
		.AddItem ""
		.AddLink "L1",h1,"K1",h2,"K2"
		.AddLink "L2",h2,"K2",h3,"K3"
		.Link("<*>",15) = 2
	End With
	.EndUpdate
End With
|
|
1785
|
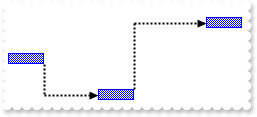
What options do I have to show the links between bars (direct)
With G2antt1
	.BeginUpdate
	.AntiAliasing = True
	.Columns.Add "Task"
	With .Chart
		.FirstVisibleDate = #1/1/2001#
		.PaneWidth(False) = 128
		.NonworkingDays = 0
		.LinksWidth = 2
	End With
	With .Items
		.AddItem ""
		h3 = .AddItem("Task 3")
		.AddItem ""
		.AddBar h3,"Task",#1/13/2001#,#1/15/2001#,"K3"
		h1 = .AddItem("Task 1")
		.AddItem ""
		.AddBar h1,"Task",#1/2/2001#,#1/4/2001#,"K1"
		h2 = .AddItem("Task 2")
		.AddBar h2,"Task",#1/7/2001#,#1/9/2001#,"K2"
		.AddItem ""
		.AddLink "L1",h1,"K1",h2,"K2"
		.AddLink "L2",h2,"K2",h3,"K3"
		.Link("<*>",15) = 1
	End With
	.EndUpdate
End With
|
|
1784
|
What options do I have to show the links between bars (round)
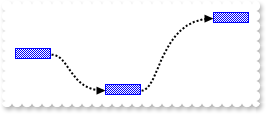
With G2antt1
	.BeginUpdate
	.AntiAliasing = True
	.Columns.Add "Task"
	With .Chart
		.FirstVisibleDate = #1/1/2001#
		.PaneWidth(False) = 128
		.NonworkingDays = 0
		.LinksWidth = 2
	End With
	With .Items
		.AddItem ""
		h3 = .AddItem("Task 3")
		.AddItem ""
		.AddBar h3,"Task",#1/13/2001#,#1/15/2001#,"K3"
		h1 = .AddItem("Task 1")
		.AddItem ""
		.AddBar h1,"Task",#1/2/2001#,#1/4/2001#,"K1"
		h2 = .AddItem("Task 2")
		.AddBar h2,"Task",#1/7/2001#,#1/9/2001#,"K2"
		.AddItem ""
		.AddLink "L1",h1,"K1",h2,"K2"
		.AddLink "L2",h2,"K2",h3,"K3"
		.Link("<*>",15) = -1
	End With
	.EndUpdate
End With
|
|
1783
|
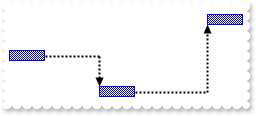
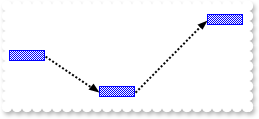
What options do I have to show the links between bars (rectangular, default)
With G2antt1
	.BeginUpdate
	.AntiAliasing = True
	.Columns.Add "Task"
	With .Chart
		.FirstVisibleDate = #1/1/2001#
		.PaneWidth(False) = 128
		.NonworkingDays = 0
		.LinksWidth = 2
	End With
	With .Items
		.AddItem ""
		h3 = .AddItem("Task 3")
		.AddItem ""
		.AddBar h3,"Task",#1/13/2001#,#1/15/2001#,"K3"
		h1 = .AddItem("Task 1")
		.AddItem ""
		.AddBar h1,"Task",#1/2/2001#,#1/4/2001#,"K1"
		h2 = .AddItem("Task 2")
		.AddBar h2,"Task",#1/7/2001#,#1/9/2001#,"K2"
		.AddItem ""
		.AddLink "L1",h1,"K1",h2,"K2"
		.AddLink "L2",h2,"K2",h3,"K3"
		.Link("<*>",15) = 0
	End With
	.EndUpdate
End With
|
|
1782
|
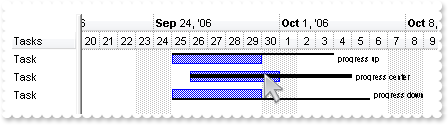
I have a question about whether the control has the functionality to add two bars on the same item, as one would correspond to the item bar and another bar their progress, but progress is required to show dividedly at different times outside the activity bar item
With G2antt1
	.BeginUpdate
	.Columns.Add "Tasks"
	.BackColorLevelHeader = .BackColor
	With .Chart
		.LevelCount = 2
		.FirstVisibleDate = #9/20/2006#
		.PaneWidth(0) = 64
		With .Bars.Copy("Progress","TProgressD")
			.Def(4) = 18
			.Shape = 20
		End With
		With .Bars.Copy("Progress","TProgressC")
			.Def(4) = 18
		End With
		With .Bars.Copy("Progress","TProgressU")
			.Def(4) = 18
			.Shape = 18
		End With
	End With
	With .Items
		h = .AddItem("Task")
		.AddBar h,"Task",#9/25/2006#,#9/30/2006#,"T1"
		.AddBar h,"TProgressU",#9/25/2006#,#10/4/2006#,"TP1"
		.GroupBars h,"T1",True,h,"TP1",True,3
		.ItemBar(h,"TP1",3) = "<font ;6>progress up"
		h = .AddItem("Task")
		.AddBar h,"Task",#9/26/2006#,#10/1/2006#,"T2"
		.AddBar h,"TProgressC",#9/26/2006#,#10/5/2006#,"TP2"
		.GroupBars h,"T2",True,h,"TP2",True,3
		.ItemBar(h,"TP2",3) = "<font ;6>progress center"
		h = .AddItem("Task")
		.AddBar h,"Task",#9/25/2006#,#9/30/2006#,"T3"
		.AddBar h,"TProgressD",#9/25/2006#,#10/6/2006#,"TP3"
		.GroupBars h,"T3",True,h,"TP3",True,3
		.ItemBar(h,"TP3",3) = "<font ;6>progress down"
	End With
	.EndUpdate
End With
|
|
1781
|
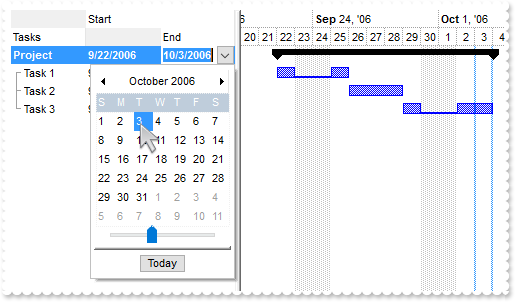
I have a column of date-type, the question is how can I move the associated bar, instead of resizing it (summary, inclusive, working)
With G2antt1
	.BeginUpdate
	.MarkSearchColumn = False
	.Indent = 11
	.HasLines = 1
	.Items.AllowCellValueToItemBar = True
	With .Columns
		.Add "Tasks"
		With .Add("Start")
			.Def(18) = 544
			.Editor.EditType = 7
			.LevelKey = 1
		End With
		With .Add("End")
			.Def(18) = 546
			.Editor.EditType = 7
			.LevelKey = 1
		End With
	End With
	With .Chart
		.FirstVisibleDate = #9/20/2006#
		.AllowLinkBars = False
		.AllowCreateBar = 0
		.LevelCount = 2
		.PaneWidth(0) = 224
		With .Bars
			With .Add("Underline")
				.Color = RGB(0,0,255)
				.Shape = 20
			End With
			With .Add("Task:Underline")
				.Shortcut = "T"
				.Def(20) = True
			End With
		End With
	End With
	With .Items
		h = .AddItem("Project")
		.AddBar h,"Summary",#9/21/2006#,#10/3/2006#
		h1 = .InsertItem(h,,"Task 1")
		.AddBar h1,"T",#9/21/2006#,#9/24/2006#
		h2 = .InsertItem(h,,"Task 2")
		.AddBar h2,"T",#9/24/2006#,#9/28/2006#
		h3 = .InsertItem(h,,"Task 3")
		.AddBar h3,"T",#9/28/2006#,#10/3/2006#
		.DefineSummaryBars h,"",h1,""
		.DefineSummaryBars h,"",h2,""
		.DefineSummaryBars h,"",h3,""
		.ExpandItem(h) = True
		.ItemBold(h) = True
		.ItemBar(h,"",544) = #9/22/2006#
	End With
	.EndUpdate
End With
|
|
1780
|
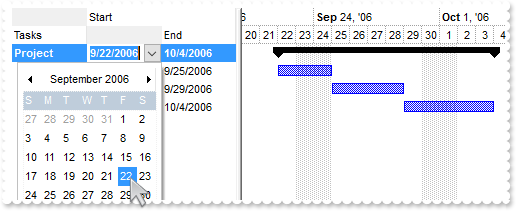
I have a column of date-type, the question is how can I move the associated bar, instead of resizing it (summary)
With G2antt1
	.BeginUpdate
	.MarkSearchColumn = False
	.Indent = 11
	.HasLines = 1
	.Items.AllowCellValueToItemBar = True
	With .Columns
		.Add "Tasks"
		With .Add("Start")
			.Def(18) = 544
			.Editor.EditType = 7
			.LevelKey = 1
		End With
		With .Add("End")
			.Def(18) = 545
			.Editor.EditType = 7
			.LevelKey = 1
		End With
	End With
	With .Chart
		.FirstVisibleDate = #9/20/2006#
		.AllowLinkBars = False
		.AllowCreateBar = 0
		.LevelCount = 2
		.PaneWidth(0) = 224
	End With
	With .Items
		h = .AddItem("Project")
		.AddBar h,"Summary",#9/21/2006#,#10/3/2006#
		h1 = .InsertItem(h,,"Task 1")
		.AddBar h1,"Task",#9/21/2006#,#9/24/2006#
		h2 = .InsertItem(h,,"Task 2")
		.AddBar h2,"Task",#9/24/2006#,#9/28/2006#
		h3 = .InsertItem(h,,"Task 3")
		.AddBar h3,"Task",#9/28/2006#,#10/3/2006#
		.DefineSummaryBars h,"",h1,""
		.DefineSummaryBars h,"",h2,""
		.DefineSummaryBars h,"",h3,""
		.ExpandItem(h) = True
		.ItemBold(h) = True
		.ItemBar(h,"",544) = #9/22/2006#
	End With
	.EndUpdate
End With
|
|
1779
|
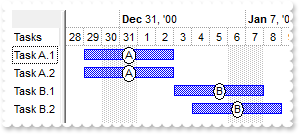
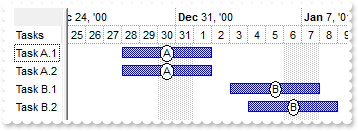
Is it possible to programmatically move all bars of specified key to end at specified date (inclusive)
With G2antt1
	.BeginUpdate
	.Debug = True
	.Columns.Add "Tasks"
	With .Chart
		.FirstVisibleDate = #1/1/2001#
		.LevelCount = 2
		.PaneWidth(False) = 48
	End With
	With .Items
		.AddBar .AddItem("Task A.1"),"Task",#1/1/2001#,#1/6/2001#,"A"
		.AddBar .AddItem("Task A.2"),"Task",#1/2/2001#,#1/7/2001#,"A"
		.AddBar .AddItem("Task B.1"),"Task",#1/3/2001#,#1/8/2001#,"B"
		.AddBar .AddItem("Task B.2"),"Task",#1/4/2001#,#1/9/2001#,"B"
		.ItemBar(0,"<A*>",546) = #1/2/2001#
	End With
	.EndUpdate
End With
|
|
1778
|
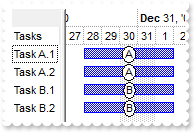
Is it possible to programmatically move all bars to end at specified date (inclusive)
With G2antt1
	.BeginUpdate
	.Debug = True
	.Columns.Add "Tasks"
	With .Chart
		.FirstVisibleDate = #1/1/2001#
		.LevelCount = 2
		.PaneWidth(False) = 48
	End With
	With .Items
		.AddBar .AddItem("Task A.1"),"Task",#1/1/2001#,#1/6/2001#,"A"
		.AddBar .AddItem("Task A.2"),"Task",#1/2/2001#,#1/7/2001#,"A"
		.AddBar .AddItem("Task B.1"),"Task",#1/3/2001#,#1/8/2001#,"B"
		.AddBar .AddItem("Task B.2"),"Task",#1/4/2001#,#1/9/2001#,"B"
		.ItemBar(0,"<*>",546) = #1/2/2001#
	End With
	.EndUpdate
End With
|
|
1777
|
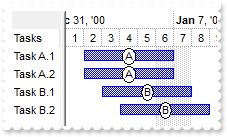
Is it possible to programmatically move all bars of specified key to end at specified date
With G2antt1
	.BeginUpdate
	.Debug = True
	.Columns.Add "Tasks"
	With .Chart
		.FirstVisibleDate = #1/1/2001#
		.LevelCount = 2
		.PaneWidth(False) = 48
	End With
	With .Items
		.AddBar .AddItem("Task A.1"),"Task",#1/1/2001#,#1/6/2001#,"A"
		.AddBar .AddItem("Task A.2"),"Task",#1/2/2001#,#1/7/2001#,"A"
		.AddBar .AddItem("Task B.1"),"Task",#1/3/2001#,#1/8/2001#,"B"
		.AddBar .AddItem("Task B.2"),"Task",#1/4/2001#,#1/9/2001#,"B"
		.ItemBar(0,"<A*>",545) = #1/2/2001#
	End With
	.EndUpdate
End With
|
|
1776
|
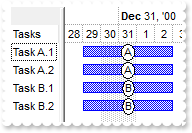
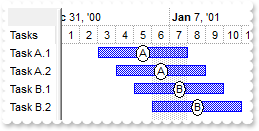
Is it possible to programmatically move all bars to end at specified date
With G2antt1
	.BeginUpdate
	.Debug = True
	.Columns.Add "Tasks"
	With .Chart
		.FirstVisibleDate = #1/1/2001#
		.LevelCount = 2
		.PaneWidth(False) = 48
	End With
	With .Items
		.AddBar .AddItem("Task A.1"),"Task",#1/1/2001#,#1/6/2001#,"A"
		.AddBar .AddItem("Task A.2"),"Task",#1/2/2001#,#1/7/2001#,"A"
		.AddBar .AddItem("Task B.1"),"Task",#1/3/2001#,#1/8/2001#,"B"
		.AddBar .AddItem("Task B.2"),"Task",#1/4/2001#,#1/9/2001#,"B"
		.ItemBar(0,"<*>",545) = #1/2/2001#
	End With
	.EndUpdate
End With
|
|
1775
|
Is it possible to programmatically move all bars of specified key to start at specified date
With G2antt1
	.BeginUpdate
	.Debug = True
	.Columns.Add "Tasks"
	With .Chart
		.FirstVisibleDate = #1/1/2001#
		.LevelCount = 2
		.PaneWidth(False) = 48
	End With
	With .Items
		.AddBar .AddItem("Task A.1"),"Task",#1/1/2001#,#1/6/2001#,"A"
		.AddBar .AddItem("Task A.2"),"Task",#1/2/2001#,#1/7/2001#,"A"
		.AddBar .AddItem("Task B.1"),"Task",#1/3/2001#,#1/8/2001#,"B"
		.AddBar .AddItem("Task B.2"),"Task",#1/4/2001#,#1/9/2001#,"B"
		.ItemBar(0,"<A*>",544) = #1/2/2001#
	End With
	.EndUpdate
End With
|
|
1774
|
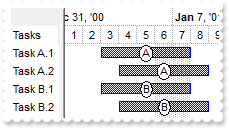
Is it possible to programmatically move all bars to start at specified date
With G2antt1
	.BeginUpdate
	.Debug = True
	.Columns.Add "Tasks"
	With .Chart
		.FirstVisibleDate = #1/1/2001#
		.LevelCount = 2
		.PaneWidth(False) = 48
	End With
	With .Items
		.AddBar .AddItem("Task A.1"),"Task",#1/1/2001#,#1/6/2001#,"A"
		.AddBar .AddItem("Task A.2"),"Task",#1/2/2001#,#1/7/2001#,"A"
		.AddBar .AddItem("Task B.1"),"Task",#1/3/2001#,#1/8/2001#,"B"
		.AddBar .AddItem("Task B.2"),"Task",#1/4/2001#,#1/9/2001#,"B"
		.ItemBar(0,"<*>",544) = #1/2/2001#
	End With
	.EndUpdate
End With
|
|
1773
|
Is it possible to programmatically move all bars of specified key
With G2antt1
	.BeginUpdate
	.Debug = True
	.Columns.Add "Tasks"
	With .Chart
		.FirstVisibleDate = #1/1/2001#
		.LevelCount = 2
		.PaneWidth(False) = 48
	End With
	With .Items
		.AddBar .AddItem("Task A.1"),"Task",#1/1/2001#,#1/6/2001#,"A"
		.AddBar .AddItem("Task A.2"),"Task",#1/2/2001#,#1/7/2001#,"A"
		.AddBar .AddItem("Task B.1"),"Task",#1/3/2001#,#1/8/2001#,"B"
		.AddBar .AddItem("Task B.2"),"Task",#1/4/2001#,#1/9/2001#,"B"
		.ItemBar(0,"<A*>",514) = 2
	End With
	.EndUpdate
End With
|
|
1772
|
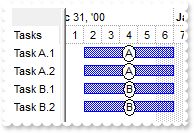
Is it possible to programmatically move all bars
With G2antt1
	.BeginUpdate
	.Debug = True
	.Columns.Add "Tasks"
	With .Chart
		.FirstVisibleDate = #1/1/2001#
		.LevelCount = 2
		.PaneWidth(False) = 48
	End With
	With .Items
		.AddBar .AddItem("Task A.1"),"Task",#1/1/2001#,#1/6/2001#,"A"
		.AddBar .AddItem("Task A.2"),"Task",#1/2/2001#,#1/7/2001#,"A"
		.AddBar .AddItem("Task B.1"),"Task",#1/3/2001#,#1/8/2001#,"B"
		.AddBar .AddItem("Task B.2"),"Task",#1/4/2001#,#1/9/2001#,"B"
		.ItemBar(0,"<*>",514) = 2
	End With
	.EndUpdate
End With
|
|
1771
|
How can I programmatically move a bar, so it ends at specified date (inclusive)
With G2antt1
	.Columns.Add "Tasks"
	With .Chart
		.FirstVisibleDate = #1/1/2001#
		.LevelCount = 2
		.PaneWidth(False) = 48
	End With
	With .Items
		h = .AddItem("Task 1")
		.AddBar h,"Task",#1/1/2001#,#1/6/2001#,"A"
		.ItemBar(h,"A",546) = #1/4/2001#
	End With
End With
|
|
1770
|
How can I programmatically move a bar, so it ends at specified date
With G2antt1
	.Columns.Add "Tasks"
	With .Chart
		.FirstVisibleDate = #1/1/2001#
		.LevelCount = 2
		.PaneWidth(False) = 48
	End With
	With .Items
		h = .AddItem("Task 1")
		.AddBar h,"Task",#1/1/2001#,#1/6/2001#,"A"
		.ItemBar(h,"A",545) = #1/4/2001#
	End With
End With
|
|
1769
|
How can I programmatically move a bar, so it starts at specified date
With G2antt1
	.Columns.Add "Tasks"
	With .Chart
		.FirstVisibleDate = #1/1/2001#
		.LevelCount = 2
		.PaneWidth(False) = 48
	End With
	With .Items
		h = .AddItem("Task 1")
		.AddBar h,"Task",#1/1/2001#,#1/6/2001#,"A"
		.ItemBar(h,"A",544) = #1/4/2001#
	End With
End With
|
|
1768
|
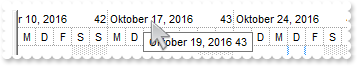
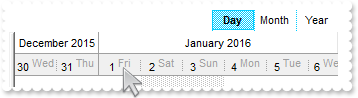
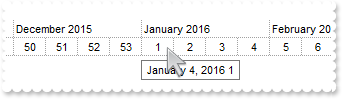
I can�t figure out how to control the date and time format (in level 0, 1 and 2) when the user click on the OverviewZoom bottom
With G2antt1
	.BeginUpdate
	.HeaderHeight = 22
	With .Chart
		.FirstVisibleDate = #1/1/2016#
		.PaneWidth(False) = 0
		.LevelCount = 2
		.DrawLevelSeparator = 2
		.AllowResizeChart = 6 ' ResizeChartEnum.exAllowResizeChartMiddle Or ResizeChartEnum.exAllowResizeChartHeader
		.MaxUnitWidth = 196
		With .Level(0)
			.Alignment = 17 ' AlignmentEnum.exHOutside Or AlignmentEnum.CenterAlignment
			.DrawTickLines = 2
		End With
		With .Level(1)
			.DrawTickLines = 65 ' LevelLineEnum.exLevelMiddleLine Or LevelLineEnum.exLevelDotLine
			.DrawTickLinesFrom 0,2
			.BackColor = RGB(240,240,240)
		End With
		.OverviewVisible = 2
		.AllowOverviewZoom = 1
		.UnitWidth = 24
		.Label(16777216) = ""
		.Label(1048576) = ""
		.Label(65536) = ""
		.Label(256) = ""
		.Label(4096) = "<font ;6><%d%><|><%d%><|><%d%> <fgcolor=A0A0A0><off -4><%d1%><|><%d%> <fgcolor=A0A0A0><off -4><%d2%><|><%d%> <fgcolor=A0A0A0><o" & _
	"ff -4><%d3%><|><%d%> <fgcolor=A0A0A0><off -4><%dddd%><||><||>4096"
		.UnitScale = 4096
		.ScrollTo .FirstVisibleDate,1
	End With
	.Columns.Add "Default"
	.EndUpdate
End With
|
|
1767
|
Can I use GroupBars with OverlaidType method
With G2antt1
	.BeginUpdate
	.Columns.Add "Tasks"
	.Debug = True
	.LinesAtRoot = -1
	.ScrollBySingleLine = True
	.BackColorLevelHeader = .BackColor
	With .Chart
		.LevelCount = 2
		.FirstVisibleDate = #9/20/2006#
		.PaneWidth(0) = 96
		.Bars.Item("Task").OverlaidType = 3
	End With
	With .Items
		h = .AddItem("Project")
		.AddBar h,"Summary",#9/21/2006#,#10/4/2006#
		h1 = .InsertItem(h,,"Tasks")
		.AddBar h1,"Task",#9/21/2006#,#9/26/2006#,"h1"
		h2 = h1
		.AddBar h2,"Task",#9/25/2006#,#9/30/2006#,"h2"
		.AddLink "L1",h1,"h1",h2,"h2"
		h3 = h1
		.AddBar h3,"Task",#9/29/2006#,#10/4/2006#,"h3"
		.AddLink "L2",h2,"h2",h3,"h3"
		.DefineSummaryBars h,"",h1,"h1"
		.DefineSummaryBars h,"",h2,"h2"
		.DefineSummaryBars h,"",h3,"h3"
		.ExpandItem(h) = True
		.ItemBold(h) = True
		.GroupBars h1,"h1",False,h2,"h2",True,31,"0;5;-1"
		.GroupBars h2,"h2",False,h3,"h3",True,31,"0;5;-1"
	End With
	.EndUpdate
End With
|
|
1766
|
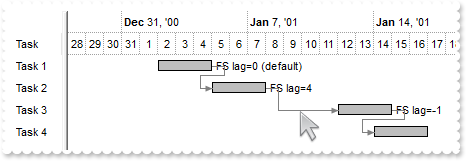
How do I change the link's lag so I can schedule bars to start later (with nonworking part)
' BarResizing event - Occurs when a bar is moving or resizing.
Private Sub G2antt1_BarResizing(ByVal Item As Long, ByVal Key As Variant)
	With G2antt1
		.Items.SchedulePDM Item,Key
	End With
End Sub

With G2antt1
	.BeginUpdate
	.DefaultItemHeight = 22
	.HeaderHeight = .DefaultItemHeight
	.BackColorLevelHeader = .BackColor
	.AntiAliasing = True
	.Columns.Add "Task"
	With .Chart
		.LinksStyle = 0
		.LinksColor = RGB(128,128,128)
		.LevelCount = 2
		.FirstVisibleDate = #12/28/2000#
		.PaneWidth(False) = 48
		With .Bars.Item("Task")
			.Def(20) = True
			.Def(4) = 18
			.Color = RGB(0,0,0)
			.StartColor = RGB(190,190,190)
			.EndColor = .StartColor
			.Pattern = 32
		End With
	End With
	With .Items
		h1 = .AddItem("Task 1")
		.AddBar h1,"Task",#1/2/2001#,#1/5/2001#,"K1","FS lag=0 (default)"
		h2 = .AddItem("Task 2")
		.AddBar h2,"Task",#1/2/2001#,#1/5/2001#,"K2","FS lag=4"
		.AddLink "L1",h1,"K1",h2,"K2"
		h3 = .AddItem("Task 3")
		.AddBar h3,"Task",#1/2/2001#,#1/5/2001#,"K3","FS lag=-1"
		.AddLink "L2",h2,"K2",h3,"K3"
		.Link("L2",16) = 4
		h4 = .AddItem("Task 4")
		.AddBar h4,"Task",#1/2/2001#,#1/5/2001#,"K4"
		.AddLink "L3",h3,"K3",h4,"K4"
		.Link("L3",16) = -1
		.SchedulePDM 0,"K1"
	End With
	.EndUpdate
End With
|
|
1765
|
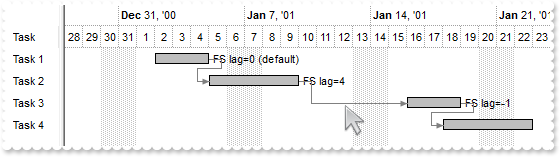
How do I change the link's lag so I can schedule bars to start later (without nonworking part)
' BarResizing event - Occurs when a bar is moving or resizing.
Private Sub G2antt1_BarResizing(ByVal Item As Long, ByVal Key As Variant)
	With G2antt1
		.Items.SchedulePDM Item,Key
	End With
End Sub

With G2antt1
	.BeginUpdate
	.DefaultItemHeight = 22
	.HeaderHeight = .DefaultItemHeight
	.BackColorLevelHeader = .BackColor
	.AntiAliasing = True
	.Columns.Add "Task"
	With .Chart
		.LinksStyle = 0
		.LinksColor = RGB(128,128,128)
		.LevelCount = 2
		.NonworkingDays = 0
		.FirstVisibleDate = #12/28/2000#
		.PaneWidth(False) = 48
		With .Bars.Item("Task")
			.Def(4) = 18
			.Color = RGB(0,0,0)
			.StartColor = RGB(190,190,190)
			.EndColor = .StartColor
			.Pattern = 32
		End With
	End With
	With .Items
		h1 = .AddItem("Task 1")
		.AddBar h1,"Task",#1/2/2001#,#1/5/2001#,"K1","FS lag=0 (default)"
		h2 = .AddItem("Task 2")
		.AddBar h2,"Task",#1/2/2001#,#1/5/2001#,"K2","FS lag=4"
		.AddLink "L1",h1,"K1",h2,"K2"
		h3 = .AddItem("Task 3")
		.AddBar h3,"Task",#1/2/2001#,#1/5/2001#,"K3","FS lag=-1"
		.AddLink "L2",h2,"K2",h3,"K3"
		.Link("L2",17) = 4
		h4 = .AddItem("Task 4")
		.AddBar h4,"Task",#1/2/2001#,#1/5/2001#,"K4"
		.AddLink "L3",h3,"K3",h4,"K4"
		.Link("L3",17) = -1
		.SchedulePDM 0,"K1"
	End With
	.EndUpdate
End With
|
|
1764
|
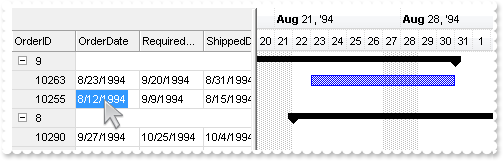
Is it possible to select the entire row/line, when user clicks the first column, and select individually the rest of cells, while user clicks any other column
' AddGroupItem event - Occurs after a new Group Item has been inserted to Items collection.
Private Sub G2antt1_AddGroupItem(ByVal Item As Long)
	With G2antt1
		With .Items
			.AddBar Item,"Summary",.CellValue(Item,2),.CellValue(Item,4)
			.DefineSummaryBars Item,"",-3,""
		End With
	End With
End Sub

' AddItem event - Occurs after a new Item has been inserted to Items collection.
Private Sub G2antt1_AddItem(ByVal Item As Long)
	With G2antt1
		With .Items
			.AddBar Item,"Task",.CellValue(Item,2),.CellValue(Item,4)
		End With
	End With
End Sub

' MouseDown event - Occurs when the user presses a mouse button.
Private Sub G2antt1_MouseDown(ByVal Button As Integer, ByVal Shift As Integer, ByVal X As Long, ByVal Y As Long)
	With G2antt1
		i = .ItemFromPoint(-1,-1,c,hit)
		.FullRowSelect = .Columns.Item(c).Data ' .Columns.Item(c).Data
	End With
End Sub

With G2antt1
	.BeginUpdate
	.HeaderHeight = 22
	.HeaderAppearance = 1
	.BackColorLock = RGB(240,240,240)
	.BackColorHeader = .BackColorLock
	.HasLines = 0
	.ColumnAutoResize = False
	.SortBarVisible = False
	.AllowGroupBy = True
	.ReadOnly = -1
	.ShowFocusRect = False
	.CountLockedColumns = 1
	.AutoDrag = 16
	.SingleSort = False
	.ColumnsAllowSizing = True
	.DrawGridLines = -1
	.GridLineStyle = 48
	.GridLineColor = RGB(220,220,220)
	.Chart.FirstVisibleDate = #9/1/1994#
	.Chart.LevelCount = 2
	.Chart.PaneWidth(False) = 256
	.BackColorSortBar = .BackColor
	.ColumnAutoResize = False
	Set rs = CreateObject("ADOR.Recordset")
	With rs
		.Open "Orders","Provider=Microsoft.ACE.OLEDB.12.0;Data Source=C:\Program Files\Exontrol\ExG2antt\Sample\Access\misc.accdb",3,3
	End With
	.DataSource = rs
	.Columns.Item(0).Data = -1
	.Layout = "singlesort=""C5:1"";multiplesort="" C1:2"""
	.EndUpdate
End With
|
|
1763
|
I've also hit a strange problem with the BeforeExpandItem event - the Cancel parameter is declared as const in Delphi when I believe it should be declared as var or out so I can use it to return OleVariant(True) to cancel the operation, or am I missing something, or how can I disable expanding / collapsing the items
' BeforeExpandItem event - Fired before an item is about to be expanded (collapsed).
Private Sub G2antt1_BeforeExpandItem(ByVal Item As Long, Cancel As Variant)
	With G2antt1
		.EventParam(1) = True
	End With
End Sub

' Event event - Notifies the application once the control fires an event.
Private Sub G2antt1_Event(ByVal EventID As Long)
	With G2antt1
		Debug.Print( .EventParam(-2) )
	End With
End Sub

With G2antt1
	.BeginUpdate
	.LinesAtRoot = -1
	.Columns.Add "Default"
	With .Items
		h = .AddItem("Root A")
		.InsertItem h,,"Child 1"
		.InsertItem h,,"Child 2"
		.ExpandItem(h) = True
		h = .AddItem("Root B")
		.InsertItem h,,"Child 1"
		.InsertItem h,,"Child 2"
		.ExpandItem(h) = True
	End With
	.EndUpdate
End With
|
|
1762
|
Is there any way I can get rid / hide of the vertical blue lines ( today, selected date )
With G2antt1
	.BeginUpdate
	With .Chart
		.PaneWidth(False) = 128
		.LevelCount = 2
		.MarkSelectDateColor = .BackColor
		.MarkTodayColor = .BackColor
	End With
	.EndUpdate
End With
|
|
1761
|
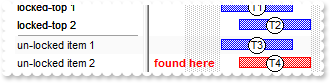
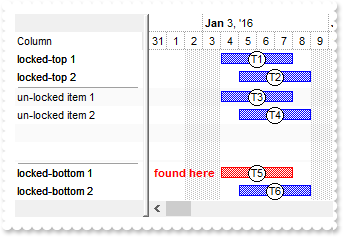
Is it possible to search for a bar through items only ( not including the locked items )
With G2antt1
	.BeginUpdate
	.Debug = True
	With .Chart
		.PaneWidth(False) = 128
		.LevelCount = 2
		.FirstVisibleDate = #12/31/2015#
	End With
	.BackColorAlternate = RGB(250,250,250)
	.ShowLockedItems = True
	.Columns.Add "Column"
	With .Columns.Add("Find")
		.Def(17) = 1
		.Visible = False
		.FormatColumn = "int(value) = 0 ? `` : ` <fgcolor=FF0000><b>found here ` "
	End With
	.Chart.ColumnsFormatLevel = "1"
	With .Items
		.LockedItemCount(0) = 3
		h = .LockedItem(0,0)
		.CellValue(h,0) = "locked-top 1"
		.AddBar h,"Task",#1/4/2016#,#1/8/2016#,"T1"
		h = .LockedItem(0,1)
		.CellValue(h,0) = "locked-top 2"
		.AddBar h,"Task",#1/5/2016#,#1/9/2016#,"T2"
		h = .LockedItem(0,2)
		.SelectItem(h) = False
		.ItemDivider(h) = 0
		.ItemHeight(h) = 2
		.AddBar .AddItem("un-locked item 1"),"Task",#1/4/2016#,#1/8/2016#,"T3"
		.AddBar .AddItem("un-locked item 2"),"Task",#1/5/2016#,#1/9/2016#,"T4"
		.LockedItemCount(1) = 3
		h = .LockedItem(1,0)
		.SelectItem(h) = False
		.ItemDivider(h) = 0
		.ItemHeight(h) = 2
		h = .LockedItem(1,1)
		.CellValue(h,0) = "locked-bottom 1"
		.AddBar h,"Task",#1/4/2016#,#1/8/2016#,"T5"
		h = .LockedItem(1,2)
		.CellValue(h,0) = "locked-bottom 2"
		.AddBar h,"Task",#1/5/2016#,#1/9/2016#,"T6"
	End With
	With .Items
		h = .FindBar("T4",0)
		.ItemBar(h,.FirstItemBar(h),33) = 255
		.CellValue(h,1) = h
	End With
	.EndUpdate
End With
|
|
1760
|
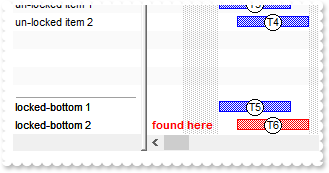
Is it possible to search for a bar through bottom-locked-items only
With G2antt1
	.BeginUpdate
	.Debug = True
	With .Chart
		.PaneWidth(False) = 128
		.LevelCount = 2
		.FirstVisibleDate = #12/31/2015#
	End With
	.BackColorAlternate = RGB(250,250,250)
	.ShowLockedItems = True
	.Columns.Add "Column"
	With .Columns.Add("Find")
		.Def(17) = 1
		.Visible = False
		.FormatColumn = "int(value) = 0 ? `` : ` <fgcolor=FF0000><b>found here ` "
	End With
	.Chart.ColumnsFormatLevel = "1"
	With .Items
		.LockedItemCount(0) = 3
		h = .LockedItem(0,0)
		.CellValue(h,0) = "locked-top 1"
		.AddBar h,"Task",#1/4/2016#,#1/8/2016#,"T1"
		h = .LockedItem(0,1)
		.CellValue(h,0) = "locked-top 2"
		.AddBar h,"Task",#1/5/2016#,#1/9/2016#,"T2"
		h = .LockedItem(0,2)
		.SelectItem(h) = False
		.ItemDivider(h) = 0
		.ItemHeight(h) = 2
		.AddBar .AddItem("un-locked item 1"),"Task",#1/4/2016#,#1/8/2016#,"T3"
		.AddBar .AddItem("un-locked item 2"),"Task",#1/5/2016#,#1/9/2016#,"T4"
		.LockedItemCount(1) = 3
		h = .LockedItem(1,0)
		.SelectItem(h) = False
		.ItemDivider(h) = 0
		.ItemHeight(h) = 2
		h = .LockedItem(1,1)
		.CellValue(h,0) = "locked-bottom 1"
		.AddBar h,"Task",#1/4/2016#,#1/8/2016#,"T5"
		h = .LockedItem(1,2)
		.CellValue(h,0) = "locked-bottom 2"
		.AddBar h,"Task",#1/5/2016#,#1/9/2016#,"T6"
	End With
	With .Items
		h = .FindBar("T6",-4)
		.ItemBar(h,.FirstItemBar(h),33) = 255
		.CellValue(h,1) = h
	End With
	.EndUpdate
End With
|
|
1759
|
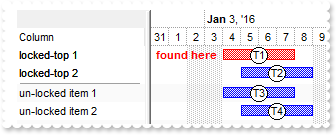
Is it possible to search for a bar through top-locked-items only
With G2antt1
	.BeginUpdate
	.Debug = True
	With .Chart
		.PaneWidth(False) = 128
		.LevelCount = 2
		.FirstVisibleDate = #12/31/2015#
	End With
	.BackColorAlternate = RGB(250,250,250)
	.ShowLockedItems = True
	.Columns.Add "Column"
	With .Columns.Add("Find")
		.Def(17) = 1
		.Visible = False
		.FormatColumn = "int(value) = 0 ? `` : ` <fgcolor=FF0000><b>found here ` "
	End With
	.Chart.ColumnsFormatLevel = "1"
	With .Items
		.LockedItemCount(0) = 3
		h = .LockedItem(0,0)
		.CellValue(h,0) = "locked-top 1"
		.AddBar h,"Task",#1/4/2016#,#1/8/2016#,"T1"
		h = .LockedItem(0,1)
		.CellValue(h,0) = "locked-top 2"
		.AddBar h,"Task",#1/5/2016#,#1/9/2016#,"T2"
		h = .LockedItem(0,2)
		.SelectItem(h) = False
		.ItemDivider(h) = 0
		.ItemHeight(h) = 2
		.AddBar .AddItem("un-locked item 1"),"Task",#1/4/2016#,#1/8/2016#,"T3"
		.AddBar .AddItem("un-locked item 2"),"Task",#1/5/2016#,#1/9/2016#,"T4"
		.LockedItemCount(1) = 3
		h = .LockedItem(1,0)
		.SelectItem(h) = False
		.ItemDivider(h) = 0
		.ItemHeight(h) = 2
		h = .LockedItem(1,1)
		.CellValue(h,0) = "locked-bottom 1"
		.AddBar h,"Task",#1/4/2016#,#1/8/2016#,"T5"
		h = .LockedItem(1,2)
		.CellValue(h,0) = "locked-bottom 2"
		.AddBar h,"Task",#1/5/2016#,#1/9/2016#,"T6"
	End With
	With .Items
		h = .FindBar("T1",-3)
		.ItemBar(h,.FirstItemBar(h),33) = 255
		.CellValue(h,1) = h
	End With
	.EndUpdate
End With
|
|
1758
|
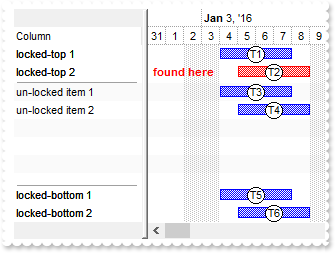
Is it possible to search for a bar through all locked-items only
With G2antt1
	.BeginUpdate
	.Debug = True
	With .Chart
		.PaneWidth(False) = 128
		.LevelCount = 2
		.FirstVisibleDate = #12/31/2015#
	End With
	.BackColorAlternate = RGB(250,250,250)
	.ShowLockedItems = True
	.Columns.Add "Column"
	With .Columns.Add("Find")
		.Def(17) = 1
		.Visible = False
		.FormatColumn = "int(value) = 0 ? `` : ` <fgcolor=FF0000><b>found here ` "
	End With
	.Chart.ColumnsFormatLevel = "1"
	With .Items
		.LockedItemCount(0) = 3
		h = .LockedItem(0,0)
		.CellValue(h,0) = "locked-top 1"
		.AddBar h,"Task",#1/4/2016#,#1/8/2016#,"T1"
		h = .LockedItem(0,1)
		.CellValue(h,0) = "locked-top 2"
		.AddBar h,"Task",#1/5/2016#,#1/9/2016#,"T2"
		h = .LockedItem(0,2)
		.SelectItem(h) = False
		.ItemDivider(h) = 0
		.ItemHeight(h) = 2
		.AddBar .AddItem("un-locked item 1"),"Task",#1/4/2016#,#1/8/2016#,"T3"
		.AddBar .AddItem("un-locked item 2"),"Task",#1/5/2016#,#1/9/2016#,"T4"
		.LockedItemCount(1) = 3
		h = .LockedItem(1,0)
		.SelectItem(h) = False
		.ItemDivider(h) = 0
		.ItemHeight(h) = 2
		h = .LockedItem(1,1)
		.CellValue(h,0) = "locked-bottom 1"
		.AddBar h,"Task",#1/4/2016#,#1/8/2016#,"T5"
		h = .LockedItem(1,2)
		.CellValue(h,0) = "locked-bottom 2"
		.AddBar h,"Task",#1/5/2016#,#1/9/2016#,"T6"
	End With
	With .Items
		h = .FindBar("T2",-2)
		.ItemBar(h,.FirstItemBar(h),33) = 255
		.CellValue(h,1) = h
	End With
	.EndUpdate
End With
|
|
1757
|
Is it possible to search for a bar through all items ( including locked items )
With G2antt1
	.BeginUpdate
	.Debug = True
	With .Chart
		.PaneWidth(False) = 128
		.LevelCount = 2
		.FirstVisibleDate = #12/31/2015#
	End With
	.BackColorAlternate = RGB(250,250,250)
	.ShowLockedItems = True
	.Columns.Add "Column"
	With .Columns.Add("Find")
		.Def(17) = 1
		.Visible = False
		.FormatColumn = "int(value) = 0 ? `` : ` <fgcolor=FF0000><b>found here ` "
	End With
	.Chart.ColumnsFormatLevel = "1"
	With .Items
		.LockedItemCount(0) = 3
		h = .LockedItem(0,0)
		.CellValue(h,0) = "locked-top 1"
		.AddBar h,"Task",#1/4/2016#,#1/8/2016#,"T1"
		h = .LockedItem(0,1)
		.CellValue(h,0) = "locked-top 2"
		.AddBar h,"Task",#1/5/2016#,#1/9/2016#,"T2"
		h = .LockedItem(0,2)
		.SelectItem(h) = False
		.ItemDivider(h) = 0
		.ItemHeight(h) = 2
		.AddBar .AddItem("un-locked item 1"),"Task",#1/4/2016#,#1/8/2016#,"T3"
		.AddBar .AddItem("un-locked item 2"),"Task",#1/5/2016#,#1/9/2016#,"T4"
		.LockedItemCount(1) = 3
		h = .LockedItem(1,0)
		.SelectItem(h) = False
		.ItemDivider(h) = 0
		.ItemHeight(h) = 2
		h = .LockedItem(1,1)
		.CellValue(h,0) = "locked-bottom 1"
		.AddBar h,"Task",#1/4/2016#,#1/8/2016#,"T5"
		h = .LockedItem(1,2)
		.CellValue(h,0) = "locked-bottom 2"
		.AddBar h,"Task",#1/5/2016#,#1/9/2016#,"T6"
	End With
	With .Items
		h = .FindBar("T5",-1)
		.ItemBar(h,.FirstItemBar(h),33) = 255
		.CellValue(h,1) = h
	End With
	.EndUpdate
End With
|
|
1756
|
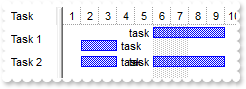
How do I clip/hide/align the bar's caption/text based on the bar's size/width/length
With G2antt1
	.BeginUpdate
	.Columns.Add "Clip"
	.ScrollBySingleLine = True
	.DrawGridLines = -2
	With .Chart
		.AllowResizeChart = 6 ' ResizeChartEnum.exAllowResizeChartMiddle Or ResizeChartEnum.exAllowResizeChartHeader
		.DrawGridLines = -2
		.FirstVisibleDate = #12/23/2000#
		.LevelCount = 2
		.PaneWidth(False) = 216
		With .Bars.Item("Task")
			.Pattern = 32
			.Color = RGB(164,164,164)
			.StartColor = RGB(240,240,240)
			.EndColor = .StartColor
			.OverlaidType = 4611 ' OverlaidBarsTypeEnum.exOverlaidBarsIncludeCaption Or OverlaidBarsTypeEnum.exOverlaidBarsStackAutoArrange Or OverlaidBarsTypeEnum.exOverlaidBarsStack
			.Height = 15
		End With
		.MinUnitWidth = .UnitWidth
	End With
	With .Items
		h = .AddItem("no clip, (0-2)")
		.AddBar h,"Task",#1/2/2001#,#1/4/2001#,"K1","no clip, right(<b>2</b>)"
		.ItemBar(h,"K1",4) = 2
		.AddBar h,"Task",#1/2/2001#,#1/4/2001#,"K2","no clip, center(<b>1</b>)"
		.ItemBar(h,"K2",4) = 1
		.AddBar h,"Task",#1/2/2001#,#1/4/2001#,"K3","no clip, left(<b>0</b>)"
		.ItemBar(h,"K3",4) = 0
		h = .AddItem("clip, inside (3-5)")
		.AddBar h,"Task",#12/28/2000#,#1/8/2001#,"K1","clip, inside, right(<b>5</b>)"
		.ItemBar(h,"K1",4) = 5
		.AddBar h,"Task",#12/28/2000#,#1/8/2001#,"K2","clip, inside, center(<b>4</b>)"
		.ItemBar(h,"K2",4) = 4
		.AddBar h,"Task",#12/28/2000#,#1/8/2001#,"K3","clip, inside, left(<b>3</b>)"
		.ItemBar(h,"K3",4) = 3
		h = .AddItem("hide on min width, clip if not fit, inside (6-8)")
		.AddBar h,"Task",#12/26/2000#,#1/10/2001#,"K1","hide on min width, clip if not fit, inside, right(<b>8</b>)"
		.ItemBar(h,"K1",4) = 8
		.AddBar h,"Task",#12/26/2000#,#1/10/2001#,"K2","hide on min width, clip if not fit, inside, center(<b>7</b>)"
		.ItemBar(h,"K2",4) = 7
		.AddBar h,"Task",#12/26/2000#,#1/10/2001#,"K3","hide on min width, clip if not fit, inside, left(<b>6</b>)"
		.ItemBar(h,"K3",4) = 6
		h = .AddItem("hide if not fit, no clip, inside (9-11)")
		.AddBar h,"Task",#12/28/2000#,#1/8/2001#,"K1","hide if not fit, no clip, inside, right(<b>11</b>)"
		.ItemBar(h,"K1",4) = 11
		.AddBar h,"Task",#12/28/2000#,#1/8/2001#,"K2","hide if not fit, no clip, center(<b>10</b>)"
		.ItemBar(h,"K2",4) = 10
		.AddBar h,"Task",#12/28/2000#,#1/8/2001#,"K3","hide if not fit, no clip, inside, left(<b>9</b>)"
		.ItemBar(h,"K3",4) = 9
		h = .AddItem("no clip, inside, outside (12-14)")
		.AddBar h,"Task",#12/28/2000#,#1/8/2001#,"K1","no clip, inside, outside, right(<b>14</b>)"
		.ItemBar(h,"K1",4) = 14
		.AddBar h,"Task",#12/28/2000#,#1/8/2001#,"K2","no clip, inside, outside, center(<b>13</b>)"
		.ItemBar(h,"K2",4) = 13
		.AddBar h,"Task",#12/28/2000#,#1/8/2001#,"K3","no clip, inside, outside, left(<b>12</b>)"
		.ItemBar(h,"K3",4) = 12
		h = .AddItem("no clip, outside (16-18)")
		.AddBar h,"Task",#12/30/2000#,#1/6/2001#,"K1","no clip, outside, right(<b>18</b>)"
		.ItemBar(h,"K1",4) = 18
		.AddBar h,"Task",#12/30/2000#,#1/6/2001#,"K2","no clip, outside, center(<b>17</b>)"
		.ItemBar(h,"K2",4) = 17
		.AddBar h,"Task",#12/30/2000#,#1/6/2001#,"K3","no clip, outside, left(<b>16</b>)"
		.ItemBar(h,"K3",4) = 16
	End With
	.EndUpdate
End With
|
|
1755
|
Is there a way to prevent the automatic horizontal scrolling of the chart when moving or resizing a bar (method 2)
' DateChange event - Occurs when the first visible date is changed.
Private Sub G2antt1_DateChange()
	With G2antt1
		.Chart.FirstVisibleDate = #1/2/2001#
	End With
End Sub

With G2antt1
	.BeginUpdate
	.Columns.Add "Tasks"
	With .Columns.Add("Start")
		.Def(18) = 1
		.Visible = False
		.Alignment = 0
	End With
	With .Columns.Add("End")
		.Def(18) = 2
		.Visible = False
		.Alignment = 2
	End With
	With .Chart
		.FirstVisibleDate = #1/2/2001#
		.LevelCount = 2
		.PaneWidth(False) = 48
		.ColumnsFormatLevel = "1[bg=12500670]:52,|,2[bg=12500670]:52"
		.ColumnsTransparent = 50
		.ScrollBar = False
	End With
	With .Items
		.AllowCellValueToItemBar = True
		.AddBar .AddItem("Task 1"),"Task",#1/3/2001#,#1/7/2001#
		.AddBar .AddItem("Task 2"),"Task",#1/4/2001#,#1/8/2001#
	End With
	.EndUpdate
End With
|
|
1754
|
Is there a way to prevent the automatic horizontal scrolling of the chart when moving or resizing a bar, including limiting the bars
' BarResizing event - Occurs when a bar is moving or resizing.
Private Sub G2antt1_BarResizing(ByVal Item As Long, ByVal Key As Variant)
	With G2antt1
		With .Items
			.ItemBar(Item,Key,22) = #1/1/2001#
			.ItemBar(Item,Key,25) = #2/1/2001#
		End With
	End With
End Sub

With G2antt1
	.BeginUpdate
	.Columns.Add "Tasks"
	With .Columns.Add("Start")
		.Def(18) = 1
		.Visible = False
		.Alignment = 0
	End With
	With .Columns.Add("End")
		.Def(18) = 2
		.Visible = False
		.Alignment = 2
	End With
	With .Chart
		.FirstVisibleDate = #1/2/2001#
		.LevelCount = 2
		.PaneWidth(False) = 48
		.ColumnsFormatLevel = "1[bg=12500670]:52,|,2[bg=12500670]:52"
		.ColumnsTransparent = 50
		.ScrollRange(0) = #1/1/2001#
		.ScrollRange(1) = #1/31/2001#
	End With
	With .Items
		.AllowCellValueToItemBar = True
		.AddBar .AddItem("Task 1"),"Task",#1/3/2001#,#1/7/2001#
		.AddBar .AddItem("Task 2"),"Task",#1/4/2001#,#1/8/2001#
	End With
	.EndUpdate
End With
|
|
1753
|
Is there a way to prevent the automatic horizontal scrolling of the chart when moving or resizing a bar (method 1)
With G2antt1
	.BeginUpdate
	.Columns.Add "Tasks"
	With .Columns.Add("Start")
		.Def(18) = 1
		.Visible = False
		.Alignment = 0
	End With
	With .Columns.Add("End")
		.Def(18) = 2
		.Visible = False
		.Alignment = 2
	End With
	With .Chart
		.FirstVisibleDate = #1/2/2001#
		.LevelCount = 2
		.PaneWidth(False) = 48
		.ColumnsFormatLevel = "1[bg=12500670]:52,|,2[bg=12500670]:52"
		.ColumnsTransparent = 50
		.ScrollRange(0) = #1/1/2001#
		.ScrollRange(1) = #1/31/2001#
	End With
	With .Items
		.AllowCellValueToItemBar = True
		.AddBar .AddItem("Task 1"),"Task",#1/3/2001#,#1/7/2001#
		.AddBar .AddItem("Task 2"),"Task",#1/4/2001#,#1/8/2001#
	End With
	.EndUpdate
End With
|
|
1752
|
Is it possible to have "Preview Window" as a "Modal Window or 'always-on-top window'"
With G2antt1
	.BeginUpdate
	.Columns.Add "Task"
	.Chart.FirstVisibleDate = #1/1/2001#
	With .Items
		h1 = .AddItem("Task 1")
		.AddBar h1,"Task",#1/2/2001#,#1/4/2001#,"K1"
		h2 = .AddItem("Task 2")
		.AddBar h2,"Task",#1/5/2001#,#1/7/2001#,"K2"
		.AddLink "L1",h1,"K1",h2,"K2"
		.Link("L1",6) = 0
	End With
	.EndUpdate
	With CreateObject("Exontrol.Print")
		Debug.Print( .Version )
		.Foreground = -1
		.PrintExt = G2antt1.Object
		.Preview
	End With
End With
|
|
1751
|
The week number is not correct (wrong). What can I do
With G2antt1
	With .Chart
		.FirstWeekDay = .LocFirstWeekDay ' .LocFirstWeekDay
		.MonthNames = .LocMonthNames
		.WeekDays = .LocWeekDays
		.AMPM = .LocAMPM
		.LevelCount = 2
		.PaneWidth(False) = 0
		.UnitScale = 256
		.UnitWidth = 32
		.FirstVisibleDate = #1/1/2016#
		.AdjustLevelsToBase = True
		.WeekNumberAs = 0
		.ShowNonworkingDates = False
		.ScrollTo .FirstVisibleDate,1
	End With
End With
|
|
1750
|
When the user zooms with the mouse, the chart automatically switches the unit scale - ideally I'd like to replicate this so I can switch the unitscale at the same "zoom levels" that the mouse zooming does - is this possible
' ChartEndChanging event - Occurs after the chart has been changed.
Private Sub G2antt1_ChartEndChanging(ByVal Operation As Long)
	With G2antt1
		With .Chart
			Debug.Print( "FirstVisibleDate" )
			Debug.Print( .FirstVisibleDate )
			Debug.Print( "UnitScale" )
			Debug.Print( .UnitScale )
			Debug.Print( "UnitWidth" )
			Debug.Print( .UnitWidth )
		End With
	End With
End Sub

With G2antt1
	.BeginUpdate
	With .Chart
		.LevelCount = 3
		.AllowResizeChart = 262 ' ResizeChartEnum.exAllowChangeUnitScale Or ResizeChartEnum.exAllowResizeChartMiddle Or ResizeChartEnum.exAllowResizeChartHeader
		.PaneWidth(False) = 0
		.MarkTodayColor = .BackColor
	End With
	.EndUpdate
End With
|
|
1749
|
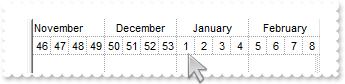
The first week number is not correctly assigned. What can I do
With G2antt1
	With .Chart
		.PaneWidth(False) = 0
		.FirstVisibleDate = #1/1/2016#
		.LevelCount = 2
		.FirstWeekDay = 1
		.UnitScale = 256
		.ScrollTo .FirstVisibleDate,1
		.DrawGridLines = -1
		.AdjustLevelsToBase = True
		.Level(0).Label = "<c><%mmmm%>"
	End With
End With
|
|
1748
|
How can I display the +/- expand - collapse buttons, a bit larger
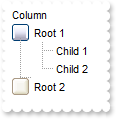
With G2antt1
	.BeginUpdate
	With .VisualAppearance
		.Add 3,"c:\exontrol\images\normal.ebn"
		.Add 4,"c:\exontrol\images\pushed.ebn"
		.Add 1,"CP:3 -4 -4 4 4"
		.Add 2,"CP:4 -4 -4 4 4"
	End With
	.LinesAtRoot = 1
	.HasButtons = 4
	.HasButtonsCustom(0) = 16777216
	.HasButtonsCustom(1) = 33554432
	.Columns.Add "Column"
	With .Items
		h = .AddItem("Root 1")
		.InsertItem h,,"Child 1"
		.InsertItem h,,"Child 2"
		.ExpandItem(h) = True
		h = .AddItem("Root 2")
		.InsertItem h,,"Child"
	End With
	.EndUpdate
End With
|
|
1747
|
Is there any option to control where I can drop the items when using the AutoDrag property
' AllowAutoDrag event - Occurs when the user drags the item between InsertA and InsertB as child of NewParent.
Private Sub G2antt1_AllowAutoDrag(ByVal Item As Long, ByVal NewParent As Long, ByVal InsertA As Long, ByVal InsertB As Long, Cancel As Boolean)
	With G2antt1
		With .Items
			Debug.Print( "NewParent" )
			Debug.Print( .CellCaption(NewParent,0) )
			Debug.Print( "After" )
			Debug.Print( .CellCaption(InsertA,0) )
			Debug.Print( "Before" )
			Debug.Print( .CellCaption(InsertB,0) )
		End With
		Cancel = True
	End With
End Sub

With G2antt1
	.BeginUpdate
	.AutoDrag = 3
	.LinesAtRoot = 0
	.HasLines = 2
	.ShowFocusRect = False
	.Columns.Add "Task"
	With .Chart
		.ShowNonworkingDates = False
		.FirstVisibleDate = #12/29/2000#
		.PaneWidth(False) = 96
		.LevelCount = 2
	End With
	With .Items
		h = .AddItem("Group 1")
		.ItemDivider(h) = 0
		.ItemBold(h) = True
		h1 = .InsertItem(h,,"Task 1")
		.AddBar h1,"Task",#1/2/2001#,#1/4/2001#,"K1"
		h2 = .InsertItem(h,,"Task 2")
		.AddBar h2,"Task",#1/5/2001#,#1/7/2001#,"K2"
		.AddLink "L1",h1,"K1",h2,"K2"
		.Link("L1",12) = "L1"
		h3 = .InsertItem(h,,"Task 3")
		.AddBar h3,"Task",#1/8/2001#,#1/10/2001#,"K3"
		.AddLink "L2",h2,"K2",h3,"K3"
		.Link("L2",12) = "L2"
		.ExpandItem(h) = True
		h = .AddItem("Group 2")
		.ItemBold(h) = True
		.ItemDivider(h) = 0
	End With
	.EndUpdate
End With
|
|
1746
|
The column (chart section ) overlaps the bars, when using the ColumnsFormatLevel property. How can I prevent that
With G2antt1
	.BeginUpdate
	.Columns.Add "Tasks"
	With .Columns.Add("Start")
		.Def(18) = 1
		.Visible = False
		.Alignment = 0
	End With
	With .Columns.Add("End")
		.Def(18) = 2
		.Visible = False
		.Alignment = 2
	End With
	With .Chart
		.FirstVisibleDate = #1/2/2001#
		.LevelCount = 2
		.PaneWidth(False) = 48
		.ColumnsFormatLevel = "1[bg=12500670]:52,|,2[bg=12500670]:52"
		.ColumnsTransparent = 50
	End With
	With .Items
		.AllowCellValueToItemBar = True
		.AddBar .AddItem("Task 1"),"Task",#1/3/2001#,#1/7/2001#
		.AddBar .AddItem("Task 2"),"Task",#1/4/2001#,#1/8/2001#
	End With
	.EndUpdate
End With
|
|
1745
|
How do I show the column ( chart section ) with a different background color, when using the ColumnsFormatLevel property (method 2)
With G2antt1
	.BeginUpdate
	.Columns.Add "Tasks"
	With .Columns.Add("Start")
		.Def(18) = 1
		.Visible = False
		.Alignment = 0
	End With
	With .Columns.Add("End")
		.Def(18) = 2
		.Visible = False
		.Alignment = 2
	End With
	With .Chart
		.FirstVisibleDate = #1/2/2001#
		.LevelCount = 2
		.PaneWidth(False) = 48
		.ColumnsFormatLevel = "1[bg=12500670]:52,|,2[bg=12500670]:52"
	End With
	With .Items
		.AllowCellValueToItemBar = True
		.AddBar .AddItem("Task 1"),"Task",#1/3/2001#,#1/7/2001#
		.AddBar .AddItem("Task 2"),"Task",#1/4/2001#,#1/8/2001#
	End With
	.EndUpdate
End With
|
|
1744
|
How do I show the column ( chart section ) with a different background color, when using the ColumnsFormatLevel property (method 1)
With G2antt1
	.BeginUpdate
	.Columns.Add "Tasks"
	With .Columns.Add("Start")
		.Def(18) = 1
		.Visible = False
		.Alignment = 0
		.Def(4) = 12500670
	End With
	With .Columns.Add("End")
		.Def(18) = 2
		.Visible = False
		.Alignment = 2
		.Def(4) = 12500670
	End With
	With .Chart
		.FirstVisibleDate = #12/31/2000#
		.LevelCount = 2
		.PaneWidth(False) = 48
		.ColumnsFormatLevel = "1:52,|,2:52"
	End With
	With .Items
		.AllowCellValueToItemBar = True
		.AddBar .AddItem("Task 1"),"Task",#1/3/2001#,#1/7/2001#
		.AddBar .AddItem("Task 2"),"Task",#1/4/2001#,#1/8/2001#
	End With
	.EndUpdate
End With
|
|
1743
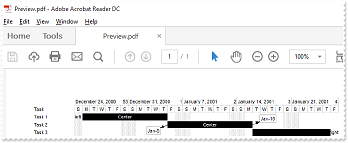
|
How can I display the control's content on an single A3 paper size, when using PDF format
With G2antt1
	.BeginUpdate
	.Columns.Add "Task"
	.AntiAliasing = True
	With .Chart
		.FirstVisibleDate = #12/24/2000#
		.PaneWidth(False) = 96
		.LevelCount = 2
		.UnitScale = 4096
		With .Bars.Item("Task")
			.Pattern = 1
			.Color = RGB(0,0,0)
			.Height = 16
		End With
	End With
	With .Items
		h = .AddItem("Task 1")
		.AddBar h,"Task",#12/25/2000#,#1/5/2001#,"1","<fgcolor=FFFFFF>Center"
		.ItemBar(h,"1",44) = "left"
		.ItemBar(h,"1",45) = 16
		h = .AddItem("Task 2")
		.AddBar h,"Task",#1/5/2001#,#1/16/2001#,"1","<fgcolor=FFFFFF>Center"
		h = .AddItem("Task 3")
		.AddBar h,"Task",#1/16/2001#,#1/26/2001#,"2","Center"
		.ItemBar(h,"2",44) = "right"
		.ItemBar(h,"2",45) = 18
	End With
	With .Chart.Notes
		With .Add("1S",G2antt1.Items.ItemByIndex(1),"1","<%m3%>-<%d%>")
			.PartShadow(1) = False
			.PartHOffset(1) = -16
			.PartVOffset(1) = 4
		End With
		With .Add("1F",G2antt1.Items.ItemByIndex(1),"1","<%m3%>-<%d%>")
			.RelativePosition = 1
			.PartShadow(1) = False
			.PartHOffset(1) = 16
			.PartVOffset(1) = -4
		End With
	End With
	var_CopyTo = .CopyTo("C:\Temp\Preview.pdf|11.69 in x 16.53 in||single")
	Debug.Print( "Look for C:\Temp\Preview.pd file." )
	.EndUpdate
End With
|
|
1742
|
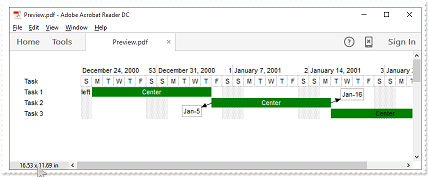
How can I display the control's content on an A3 paper size, when using PDF format
With G2antt1
	.BeginUpdate
	.Columns.Add "Task"
	.AntiAliasing = True
	With .Chart
		.FirstVisibleDate = #12/24/2000#
		.PaneWidth(False) = 96
		.LevelCount = 2
		.UnitScale = 4096
		With .Bars.Item("Task")
			.Pattern = 1
			.Color = RGB(0,0,0)
			.Height = 16
		End With
	End With
	With .Items
		h = .AddItem("Task 1")
		.AddBar h,"Task",#12/25/2000#,#1/5/2001#,"1","<fgcolor=FFFFFF>Center"
		.ItemBar(h,"1",44) = "left"
		.ItemBar(h,"1",45) = 16
		h = .AddItem("Task 2")
		.AddBar h,"Task",#1/5/2001#,#1/16/2001#,"1","<fgcolor=FFFFFF>Center"
		h = .AddItem("Task 3")
		.AddBar h,"Task",#1/16/2001#,#1/26/2001#,"2","Center"
		.ItemBar(h,"2",44) = "right"
		.ItemBar(h,"2",45) = 18
	End With
	With .Chart.Notes
		With .Add("1S",G2antt1.Items.ItemByIndex(1),"1","<%m3%>-<%d%>")
			.PartShadow(1) = False
			.PartHOffset(1) = -16
			.PartVOffset(1) = 4
		End With
		With .Add("1F",G2antt1.Items.ItemByIndex(1),"1","<%m3%>-<%d%>")
			.RelativePosition = 1
			.PartShadow(1) = False
			.PartHOffset(1) = 16
			.PartVOffset(1) = -4
		End With
	End With
	var_CopyTo = .CopyTo("C:\Temp\Preview.pdf|11.69 in x 16.53 in")
	Debug.Print( "Look for C:\Temp\Preview.pd file." )
	.EndUpdate
End With
|
|
1741
|
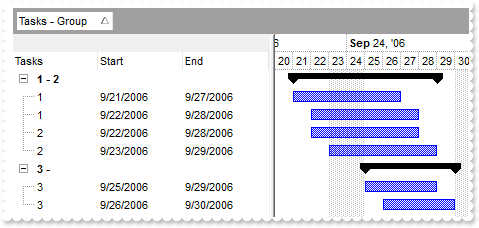
How can I specify the grouping strategy, ie numbers from 1 to 5 are given the value (1-5) and grouping is done on this new value
' AddGroupItem event - Occurs after a new Group Item has been inserted to Items collection.
Private Sub G2antt1_AddGroupItem(ByVal Item As Long)
	With G2antt1
		With .Items
			.ItemBold(Item) = True
			.AddBar Item,"Summary",.CellValue(Item,1),.CellValue(Item,2)
			.DefineSummaryBars Item,"",-3,""
		End With
	End With
End Sub

With G2antt1
	.BeginUpdate
	.AllowGroupBy = True
	.SortBarVisible = True
	.MarkSearchColumn = False
	With .Columns
		.Add "Tasks"
		With .Add("Start")
			.Def(18) = 1
			.AllowGroupBy = False
		End With
		With .Add("End")
			.Def(18) = 2
			.AllowGroupBy = False
		End With
	End With
	With .Chart
		.FirstVisibleDate = #9/20/2006#
		.LevelCount = 2
		.PaneWidth(0) = 256
	End With
	With .Items
		.AllowCellValueToItemBar = True
		.AddBar .AddItem("1"),"Task",#9/21/2006#,#9/27/2006#
		.AddBar .AddItem("1"),"Task",#9/22/2006#,#9/28/2006#
		.AddBar .AddItem("2"),"Task",#9/22/2006#,#9/28/2006#
		.AddBar .AddItem("2"),"Task",#9/23/2006#,#9/29/2006#
		.AddBar .AddItem("3"),"Task",#9/25/2006#,#9/29/2006#
		.AddBar .AddItem("3"),"Task",#9/26/2006#,#9/30/2006#
	End With
	With .Columns.Add("Tasks - Group")
		.Visible = False
		.FormatColumn = "%0 in (1,2) ? `1 - 2` : `3 -`"
		.SortOrder = 1
	End With
	.EndUpdate
End With
|
|
1740
|
How can I filter the chart and its content, not the items section
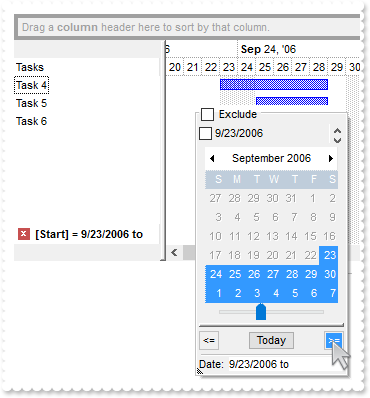
' RClick event - Fired when right mouse button is clicked
Private Sub G2antt1_RClick()
	With G2antt1
		.Columns.Item("Start").ShowFilter "-1,-1,128,128"
	End With
End Sub

With G2antt1
	.BeginUpdate
	.SortBarVisible = True
	.MarkSearchColumn = False
	With .Columns
		.Add "Tasks"
		With .Add("Start")
			.Def(18) = 1
			.DisplayFilterDate = True
			.DisplayFilterPattern = False
			.FilterList = 8448 ' FilterListEnum.exShowExclude Or FilterListEnum.exShowCheckBox
			.Visible = False
		End With
		With .Add("End")
			.Def(18) = 2
			.DisplayFilterDate = True
			.DisplayFilterPattern = False
			.Visible = False
			.FilterList = 8448 ' FilterListEnum.exShowExclude Or FilterListEnum.exShowCheckBox
			.Visible = False
		End With
	End With
	With .Chart
		.FirstVisibleDate = #9/20/2006#
		.LevelCount = 2
		.PaneWidth(0) = 128
	End With
	With .Items
		.AllowCellValueToItemBar = True
		.AddBar .AddItem("Task 1"),"Task",#9/21/2006#,#9/27/2006#
		.AddBar .AddItem("Task 2"),"Task",#9/22/2006#,#9/28/2006#
		.AddBar .AddItem("Task 3"),"Task",#9/22/2006#,#9/28/2006#
		.AddBar .AddItem("Task 4"),"Task",#9/23/2006#,#9/29/2006#
		.AddBar .AddItem("Task 5"),"Task",#9/25/2006#,#9/29/2006#
		.AddBar .AddItem("Task 6"),"Task",#9/26/2006#,#9/30/2006#
	End With
	.EndUpdate
End With
|
|
1739
|
How do I enable the Group-By feature
' AddGroupItem event - Occurs after a new Group Item has been inserted to Items collection.
Private Sub G2antt1_AddGroupItem(ByVal Item As Long)
	With G2antt1
		With .Items
			.ItemBackColor(Item) = RGB(240,240,240)
			G2antt1.Chart.ItemBackColor(Item) = RGB(240,240,240)
			.ItemDividerLine(Item) = 0
			.AddBar Item,"Summary",.CellValue(Item,1),.CellValue(Item,2)
			.DefineSummaryBars Item,"",-3,""
		End With
	End With
End Sub

With G2antt1
	.BeginUpdate
	.AllowGroupBy = True
	.SortBarVisible = True
	.MarkSearchColumn = False
	With .Columns
		.Add "Tasks"
		With .Add("Start")
			.Def(18) = 1
			.AllowGroupBy = False
		End With
		With .Add("End")
			.Def(18) = 2
			.AllowGroupBy = False
		End With
	End With
	With .Chart
		.FirstVisibleDate = #9/20/2006#
		.LevelCount = 2
		.PaneWidth(0) = 256
	End With
	With .Items
		.AllowCellValueToItemBar = True
		.AddBar .AddItem("Task 1"),"Task",#9/21/2006#,#9/27/2006#
		.AddBar .AddItem("Task 1"),"Task",#9/22/2006#,#9/28/2006#
		.AddBar .AddItem("Task 2"),"Task",#9/22/2006#,#9/28/2006#
		.AddBar .AddItem("Task 2"),"Task",#9/23/2006#,#9/29/2006#
		.AddBar .AddItem("Task 3"),"Task",#9/25/2006#,#9/29/2006#
		.AddBar .AddItem("Task 3"),"Task",#9/26/2006#,#9/30/2006#
	End With
	.Columns.Item(0).SortOrder = 1
	.EndUpdate
End With
|
|
1738
|
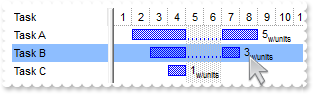
Is there any method to know number/length/count/duration of working days in a bar ( excluding non-working days)
' SelectionChanged event - Fired after a new item has been selected.
Private Sub G2antt1_SelectionChanged()
	With G2antt1
		With .Items
			Debug.Print( .CellCaption(.FocusItem,0) )
			Debug.Print( .ItemBar(.FocusItem,"",258) )
		End With
	End With
End Sub

With G2antt1
	.BeginUpdate
	.SelBackColor = RGB(142,190,255)
	.SelForeColor = RGB(0,0,0)
	With .Chart
		.PaneWidth(False) = 96
		.FirstVisibleDate = #1/1/2002#
		With .Bars.Add("Task:Split")
			.Shortcut = "Task"
			.Def(3) = "<%=%258%><font ;6><off 3>w/units"
			.Def(4) = 18
		End With
		.SelBackColor = G2antt1.SelBackColor
	End With
	.Columns.Add "Task"
	With .Items
		h = .AddItem("Task A")
		.AddBar h,"Task",#1/2/2002#,#1/9/2002#
		h = .AddItem("Task B")
		.AddBar h,"Task",#1/3/2002#,#1/8/2002#
		.SelectItem(h) = True
		h = .AddItem("Task C")
		.AddBar h,"Task",#1/4/2002#,#1/5/2002#
	End With
	.EndUpdate
End With
|
|
1737
|
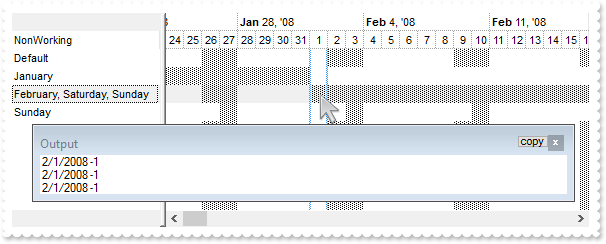
How do i verify weather specified unit is Nonworking Working Unit
' MouseMove event - Occurs when the user moves the mouse.
Private Sub G2antt1_MouseMove(ByVal Button As Integer, ByVal Shift As Integer, ByVal X As Long, ByVal Y As Long)
	With G2antt1
		h = .ItemFromPoint(-1,-1,c,hit)
		d = .Chart.DateFromPoint(-1,-1)
		Debug.Print( d )
		Debug.Print( .Chart.IsNonworkingDate(d,h) )
	End With
End Sub

With G2antt1
	.BeginUpdate
	.Columns.Add "NonWorking"
	With .Chart
		.FirstWeekDay = 1
		.FirstVisibleDate = #1/24/2008#
		.PaneWidth(False) = 64
		.LevelCount = 2
	End With
	With .Items
		h = .AddItem("Default")
		h = .AddItem("January")
		.ItemNonworkingUnits(h,False) = "month(value) = 1"
		h = .AddItem("February, Saturday, Sunday")
		.ItemNonworkingUnits(h,False) = "month(value) = 2 or (weekday(value) = 0 or weekday(value) = 6)"
		h = .AddItem("Sunday")
		.ItemNonworkingUnits(h,False) = "weekday(value) = 0"
	End With
	.EndUpdate
End With
|
|
1736
|
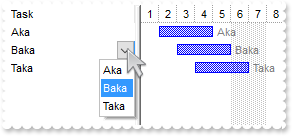
How can I specify the bar's caption to be caption from a column/cell
' Change event - Occurs when the user changes the cell's content.
Private Sub G2antt1_Change(ByVal Item As Long, ByVal ColIndex As Long, NewValue As Variant)
	With G2antt1
		.Refresh
	End With
End Sub

With G2antt1
	.BeginUpdate
	With .Chart
		.FirstVisibleDate = #1/1/2001#
		.PaneWidth(False) = 64
		With .Bars.Item("Task")
			.Def(3) = "<fgcolor=808080><%=%C0%>"
			.Def(4) = 18
		End With
	End With
	With .Columns.Add("Task").Editor
		.EditType = 3
		.AddItem 1,"Aka"
		.AddItem 2,"Baka"
		.AddItem 3,"Taka"
	End With
	With .Items
		.AddBar .AddItem(1),"Task",#1/2/2001#,#1/5/2001#
		.AddBar .AddItem(2),"Task",#1/3/2001#,#1/6/2001#
		.AddBar .AddItem(3),"Task",#1/4/2001#,#1/7/2001#
	End With
	.EndUpdate
End With
|
|
1735
|
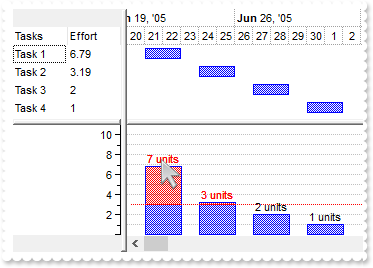
The histogram values displayed on the chart are using 2 decimal places. Can this be formated to just 0 decimal place, so 86.79% becomes 87%
With G2antt1
	.BeginUpdate
	.Columns.Add "Tasks"
	With .Columns.Add("Effort")
		.Def(18) = 21
		.Editor.EditType = 4
	End With
	With .Chart
		.LevelCount = 2
		.NonworkingDays = 0
		.PaneWidth(False) = 96
		.FirstVisibleDate = #6/20/2005#
		.HistogramVisible = True
		.HistogramHeight = 128
		.HistogramView = 112
		With .Bars.Item("Task")
			.HistogramPattern = .Pattern ' .Pattern
			.HistogramType = 0
			.HistogramCriticalValue = 3
			.ShowHistogramValues = "value>3?255:1"
			.HistogramItems = -11
			.HistogramGridLinesColor = RGB(192,192,192)
			.HistogramRulerLinesColor = RGB(0,0,1)
			.FormatHistogramValues = "(value format `0`) + ` units`"
		End With
	End With
	With .Items
		.AllowCellValueToItemBar = True
		h1 = .AddItem("Task 1")
		.AddBar h1,"Task",#6/21/2005#,#6/23/2005#
		.CellValue(h1,1) = 6.79
		h1 = .AddItem("Task 2")
		.AddBar h1,"Task",#6/24/2005#,#6/26/2005#
		.CellValue(h1,1) = 3.19
		h1 = .AddItem("Task 3")
		.AddBar h1,"Task",#6/27/2005#,#6/29/2005#
		.CellValue(h1,1) = 2
		h1 = .AddItem("Task 4")
		.AddBar h1,"Task",#6/30/2005#,#7/2/2005#
		.CellValue(h1,1) = 1
	End With
	.EndUpdate
End With
|
|
1734
|
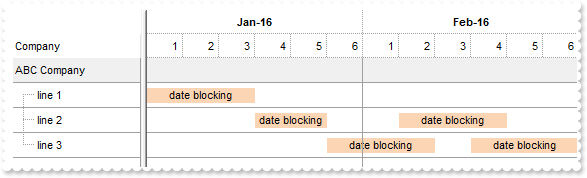
How can I create a relative time-scale
With G2antt1
	.BeginUpdate
	.DefaultItemHeight = 24
	.HeaderHeight = .DefaultItemHeight
	.GridLineStyle = 48
	.DrawGridLines = -1
	.LinesAtRoot = 0
	.BackColorLevelHeader = .BackColor
	With .Chart
		.DrawGridLines = -1
		.GridLineStyle = 48
		.PaneWidth(False) = 128
		.LevelCount = 2
		.FirstVisibleDate = 0
		.NonworkingDays = 0
		.UnitWidth = 36
		With .Level(0)
			.Unit = 4096
			.Count = 6
			.Alignment = 1
			.Label = "<%i%>"
			.FormatLabel = "'<b>' + ( (value / 6)  array ('Jan','Feb','Mar','Apr','May','Jun','Jul','Aug','Sep','Oct','Nov','Dec') ) + '-16'"
		End With
		With .Level(1)
			.Label = "<%i%>"
			.FormatLabel = "1 + value mod 6 + ` `"
			.Alignment = 2
		End With
		.AdjustLevelsToBase = True
		.ScrollRange(0) = 0
		.ScrollRange(1) = 95
		With .Bars.Item("Task")
			.Height = 15
			.Color = RGB(252,213,180)
			.Pattern = 1
			.Def(3) = "date blocking"
		End With
	End With
	.Columns.Add "Company"
	With .Items
		h = .AddItem("ABC Company")
		.ItemBackColor(h) = RGB(240,240,240)
		G2antt1.Chart.ItemBackColor(h) = RGB(240,240,240)
		hChild = .InsertItem(h,,"line 1")
		.AddBar hChild,"Task",0,3
		hChild = .InsertItem(h,,"line 2")
		.AddBar hChild,"Task",3,5,"A"
		.AddBar hChild,"Task",7,10,"B"
		hChild = .InsertItem(h,,"line 3")
		.AddBar hChild,"Task",5,8,"A"
		.AddBar hChild,"Task",9,12,"B"
		.ExpandItem(h) = True
	End With
	.EndUpdate
End With
|
|
1733
|
Extending the bar's visual appearance with additional objects, EBNs, using the exBarBackgroundExt and exBarBackgroundExtInflate
With G2antt1
	.BeginUpdate
	.DefaultItemHeight = 32
	With .VisualAppearance
		.Add 1,"gBFLBCJwBAEHhEJAADhABcMIQAAYAQGKIYBkAKBQAGaAoDDUMQyQwAAyDAK8EwsACEIrAAJoaAAPoJRDGMTvfIgARIf6MIRAeCYFDAJQtDCMICwSKsXBaGwBJYGGaYE" & _
	"DGHQATxKM7wGBcEyLDSgXZDQRAAoqTI/SICEIlAZJRjoOo5DJGGQmChkQhNVzGQzQSJFDTNAaEAwidDJCoOGgkBw7NwXFaNZznBK7LpvK5HNrie55XzAcj3dbmAYJQzB" & _
	"JLxKSIDwCd6NXrCOJ5HhWDzjQjJMozLC8YiPG6fZRbeT4ToGNdXYhJWiyLiFeYtVzSMj1fD9Ir/EakbLtey4Lq2A53RzdHThSQpCwPA4BgIA="
		.Add 2,"gBFLBCJwBAEHhEJAADhABcMIQAAYAQGKIYBkAKBQAGaAoDDUMQyQwAAyDAK8EwsACEIrAAJoaAAPoJRDGMTvfIgARIf6MIRAeCYFDAJQtDCMICwSKsXBaGwBJYGGaYE" & _
	"DGHQATxKM7wGBcEyLDSgXZDQRAAoqTI/SICEIlAZJRjoOo5DJGGQmChkQhNVzGQzQSJFDTNAaEAwidDJCoOGgkBw7NrXHZ9YwTOC5IDke67cr2J53XZAd4QTb2Cz7QC8" & _
	"QAvDA7awafM1MSuHIcOw/AqTYDkTq4XjODYhTDEc4zPLcFx/I6haBoWCSLi+T5VVrRMo1TKtRxnNaubZqO5aRrGe5NW6EXThSQpCr+f4BgIA="
		.Add 3,"gBFLBCJwBAEHhEJAADhABcMIQAAYAQGKIYBkAKBQAGaAoDDUMQyQwAAyDAK8EwsACEIrAAJoaAAPoJRDGMTvfIgARIf6MIRAeCYFDAJQtDCMICwSKsXBaGwBJYGGaYE" & _
	"DGHQATxKM7wGBcEyLDSgXZDQRAAoqTI/SICEIlAZJRjoOo5DJGGQmChkQhNVzGQzQSJFDTNAaEAwidDJCoOGgkBw7NwXFaNZznBK7LpvK5HNrie55XxfV6YBa8B4JPaE" & _
	"ZLwLB7dwaf6IQLiWLYHiAAYZRKTcxlDI8AwvFaaZjnWA5ZaOMZBU7RNRyHR9IyTDaWaTqeqbHIuJ4FUzaNY2fZrOz2F6FAA6cKSFIWFYVAMBA"
		.Add 4,"gBFLBCJwBAEHhEJAADhABb8IQAAYAQGKIYBkAKBQAGaAoDDUMQyQwAAyDAK8EwsACEIrAAJoaAAPoJRDGMTvfIgARIf6MIRAeCYFDAJQtDCMICwSKsXBaGwBJYGGaYE" & _
	"DGHQATxKM7wGBcEyLDSgXZDQRAAoqTI/SICEIlAZJRjoOo5DJGGQmChkQhNVzGQzQSJFDTNAaEAwidDJCoOGgkBw7NwXFaNZznBK7LpvK5HNrie55XxfV6YBa8B4JPaE" & _
	"ZLwLB7dwaf6IQLiWLYHiAAYBIbJI5yeb5Hx3HqfZjbeSxVoML43SzHcByGRcTwzC6pYjrGoZJpWZ4ZQrbNR3DZ8VzzNTrQxIUhYVhUAkB"
		.RenderType = -16777216
	End With
	With .Chart
		.PaneWidth(False) = 164
		.FirstVisibleDate = #1/1/2001#
		.NonworkingDaysColor = RGB(240,240,240)
		.NonworkingDaysPattern = 6
		With .Bars.Item("Task")
			.Height = 17
			.Color = RGB(255,255,255)
			.Pattern = 1
			.Def(51) = 1
		End With
	End With
	.Columns.Add "Column"
	With .Items
		.AddBar .AddItem("Task"),"Task",#1/2/2001#,#1/6/2001#,""
		h = .AddItem("Task+Rhombus(red)")
		.AddBar h,"Task",#1/2/2001#,#1/7/2001#,""
		.ItemBar(h,"",53) = "none[(100%-11,50%-6,11,11),back=0x10000FF]"
		.ItemBar(h,"",55) = ",,5"
		h = .AddItem("Rhombus(red)+Task")
		.AddBar h,"Task",#1/2/2001#,#1/8/2001#,""
		.ItemBar(h,"",53) = "none[(0,50%-6,11,11),back=0x10000FF]"
		.ItemBar(h,"",55) = "-5"
		h = .AddItem("Task(yellow)+Rhombus(blue)")
		.AddBar h,"Task",#1/2/2001#,#1/9/2001#,""
		.ItemBar(h,"",53) = "none[(100%-11,50%-6,11,11),back=0x1FF0000]"
		.ItemBar(h,"",55) = ",,5"
		.ItemBar(h,"",33) = 65535
		h = .AddItem("Rhombus(blue)+Task(yellow)")
		.AddBar h,"Task",#1/2/2001#,#1/8/2001#,""
		.ItemBar(h,"",53) = "none[(0,50%-6,11,11),back=0x1FF0000]"
		.ItemBar(h,"",55) = "-5"
		.ItemBar(h,"",33) = 65535
		h = .AddItem("TriangleUp(white)+Task")
		.AddBar h,"Task",#1/2/2001#,#1/7/2001#,""
		.ItemBar(h,"",53) = "none[(0,50%-6,11,11),back=0x2FFFFFF]"
		.ItemBar(h,"",55) = "-5"
		h = .AddItem("TriangleUp(blue)+Task(magenta)+TriangleDown(red)")
		.AddBar h,"Task",#1/2/2001#,#1/6/2001#,""
		.ItemBar(h,"",53) = "none[(0,50%-6,11,11),back=0x02FF0000],none[(100%-11,50%-6,11,11),back=0x030000FF]"
		.ItemBar(h,"",55) = "-5,0,5,0"
		.ItemBar(h,"",33) = 16744703
		h = .AddItem("Rhombus+Task+TriangleDown")
		.AddBar h,"Task",#1/2/2001#,#1/7/2001#,""
		.ItemBar(h,"",53) = "none[(0,50%-6,11,11),back=0x01FF0000],none[(100%-11,50%-6,11,11),back=0x030000FF]"
		.ItemBar(h,"",55) = "-5, 0,5,0"
		.ItemBar(h,"",33) = 16744448
		h = .AddItem("Rhombus+Task+TriangleDown")
		.AddBar h,"Task",#1/2/2001#,#1/8/2001#,""
		.ItemBar(h,"",53) = "none[(50%-6,0,11,11),back=0x01FF0000],none[(50%-6,100%-11,11,11),back=0x010000FF]"
		.ItemBar(h,"",55) = "0,-5,0,5"
		h = .AddItem("Task+Star")
		.AddBar h,"Task",#1/2/2001#,#1/9/2001#,""
		.ItemBar(h,"",53) = "none[(100%-11,0,11,11),back=0x4FFFFFF]"
		.ItemBar(h,"",55) = 5
		h = .AddItem("Star+Task")
		.AddBar h,"Task",#1/2/2001#,#1/8/2001#,""
		.ItemBar(h,"",53) = "none[(0,100%-11,11,11),back=0x04FFFFFF]"
		.ItemBar(h,"",55) = 5
		h = .AddItem("Task+Star")
		.AddBar h,"Task",#1/2/2001#,#1/7/2001#,""
		.ItemBar(h,"",53) = "none[(100%-11,0,11,11),back=0x4FFFFFF]"
		.ItemBar(h,"",55) = "0,-6,14"
	End With
	.EndUpdate
End With
|
|
1732
|
I am using the ItemBar(exBarFrameColor) to display an additional EBN on the current bar. The problem is that I still need a black frame around the bar. How can I achieve that
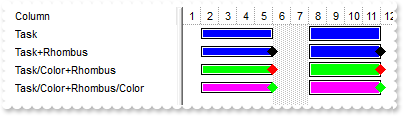
With G2antt1
	.BeginUpdate
	With .VisualAppearance
		.Add 1,"gBFLBCJwBAEHhEJAADhABXMIQAAYAQGKIYBkAKBQAGaAoDDWDoMAANAyjPBMKgBBCLAACaKQAD6CYQRhFT7yGAERr/C6EQLhGBRQCULQxDCBMIjLJoWhsASVRhnCBBR" & _
	"hwAI7ShPUBgXBNCQzICTJJkSJZBiECIJFAaJhnIapZDKGKQWCjAgiNpqGQ2QiKFC2HAcEAxCxGJBoKKZGq2bpJQLbdxUXRVZzpNi7Louay5CrOCZvXxaeAXDa+Az5ODD" & _
	"MRwLBcKhzCKDYzfdrZFaWFT3Qi8aCvG6sbw/HZ0OrEEIwCEBA"
		.Add 2,"CP:1 0 0 5 0"
		.Add 3,"gBFLBCJwBAEHhEJAADhABUEIQAAYAQGKIYBkAKBQAGaAoDDWDoMAANAyjPBMKgBBCLIxhEYobgmGIaRiBMIxAKIZhzEgYRoiAYhXDiHwxARHUgRfIEOwHDiBZomWKZE" & _
	"iaKIqRrLMryFLMZx3CqcAApGaqHiOCYlSbTcoyfJYZBzD6mKJpWipWheW48U7PVRDJSkNysASZIyrGKqJouX4WR7BcZgNR4YBgEoWRouSBLWrgNIVR6/eBABZFPzbNK3" & _
	"ZzdOIIJgEgIA="
		.RenderType = -16777216
	End With
	With .Chart
		.PaneWidth(False) = 164
		.FirstVisibleDate = #1/1/2001#
		.Bars.Item("Task").Color = &H3ff0000
		.Bars.Copy("Task","NewTask").Height = 15
	End With
	.Columns.Add "Column"
	With .Items
		h = .AddItem("Task")
		.AddBar h,"Task",#1/2/2001#,#1/6/2001#
		.AddBar h,"NewTask",#1/8/2001#,#1/12/2001#,"new"
		h = .AddItem("Task+Rhombus")
		.AddBar h,"Task",#1/2/2001#,#1/6/2001#
		.ItemBar(h,"",51) = 33554432
		.AddBar h,"NewTask",#1/8/2001#,#1/12/2001#,"new"
		.ItemBar(h,"new",51) = 33554432
		h = .AddItem("Task/Color+Rhombus")
		.AddBar h,"Task",#1/2/2001#,#1/6/2001#
		.ItemBar(h,"",51) = 33554687
		.ItemBar(h,"",33) = 65280
		.AddBar h,"NewTask",#1/8/2001#,#1/12/2001#,"new"
		.ItemBar(h,"new",51) = 33554687
		.ItemBar(h,"new",33) = 65280
		h = .AddItem("Task/Color+Rhombus/Color")
		.AddBar h,"Task",#1/2/2001#,#1/6/2001#
		.ItemBar(h,"",51) = 33619712
		.ItemBar(h,"",33) = 16711935
		.AddBar h,"NewTask",#1/8/2001#,#1/12/2001#,"new"
		.ItemBar(h,"new",51) = 33619712
		.ItemBar(h,"new",33) = 16711935
	End With
	.EndUpdate
End With
|
|
1731
|
I am using EBN objects to show my bars, but when apply a color to the EBN looks darker. Is it possible to get the same color brightness
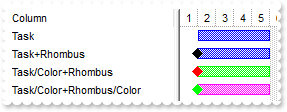
With G2antt1
	.BeginUpdate
	With .VisualAppearance
		.Add 1,"gBFLBCJwBAEHhEJAADhABWkIQAAYAQGKIYBkAKBQAGaAoDDWDoMAANAyjPBMKgBBCLAACaKQAD6CYQRhFT7yGAERr/C6EZBGABYJDUMAlCyNQBQSKIYxnAgYY4ACZ5I" & _
	"jqAwLQjQEYzZI0SxJCqQZBBCCSQKkYx0HScRijDILBQwIQmaqjEZoJCiQZfQLCAYRMhkQx9DKTLRtKhYDqubpHUZbdwWRaVYTlM6RLbhGy7YqefJtXLfN4WZgWCz9QLD" & _
	"I4wS78JruaqOW5hVz4BasfTrOzLcTzG4HLhCCYBgI"
		.Add 2,"CP:1 -6 0 0 0"
		.RenderType = -16777216
	End With
	With .Chart
		.PaneWidth(False) = 164
		.FirstVisibleDate = #1/1/2001#
	End With
	.Columns.Add "Column"
	With .Items
		h = .AddItem("Task")
		.AddBar h,"Task",#1/2/2001#,#1/6/2001#
		h = .AddItem("Task+Rhombus")
		.AddBar h,"Task",#1/2/2001#,#1/6/2001#
		.ItemBar(h,"",51) = 33554432
		h = .AddItem("Task/Color+Rhombus")
		.AddBar h,"Task",#1/2/2001#,#1/6/2001#
		.ItemBar(h,"",51) = 33554687
		.ItemBar(h,"",33) = 65280
		h = .AddItem("Task/Color+Rhombus/Color")
		.AddBar h,"Task",#1/2/2001#,#1/6/2001#
		.ItemBar(h,"",51) = 33619712
		.ItemBar(h,"",33) = 16711935
	End With
	.EndUpdate
End With
|
|
1730
|
The ItemBar(exBarColor) changes the color for margins, and there is no exBarStartColor/exBarEndColor. However in my case I would then like do dynamically change the bar color to a different color without changing the start shape color
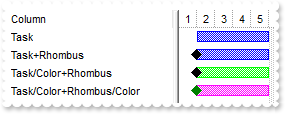
With G2antt1
	.BeginUpdate
	With .VisualAppearance
		.Add 1,"gBFLBCJwBAEHhEJAADhABWkIQAAYAQGKIYBkAKBQAGaAoDDWDoMAANAyjPBMKgBBCLAACaKQAD6CYQRhFT7yGAERr/C6EZBGABYJDUMAlCyNQBQSKIYxnAgYY4ACZ5I" & _
	"jqAwLQjQEYzZI0SxJCqQZBBCCSQKkYx0HScRijDILBQwIQmaqjEZoJCiQZfQLCAYRMhkQx9DKTLRtKhYDqubpHUZbdwWRaVYTlM6RLbhGy7YqefJtXLfN4WZgWCz9QLD" & _
	"I4wS78JruaqOW5hVz4BasfTrOzLcTzG4HLhCCYBgI"
		.Add 2,"CP:1 -6 0 0 0"
	End With
	With .Chart
		.PaneWidth(False) = 164
		.FirstVisibleDate = #1/1/2001#
	End With
	.Columns.Add "Column"
	With .Items
		h = .AddItem("Task")
		.AddBar h,"Task",#1/2/2001#,#1/6/2001#
		h = .AddItem("Task+Rhombus")
		.AddBar h,"Task",#1/2/2001#,#1/6/2001#
		.ItemBar(h,"",51) = 33554432
		h = .AddItem("Task/Color+Rhombus")
		.AddBar h,"Task",#1/2/2001#,#1/6/2001#
		.ItemBar(h,"",51) = 33554432
		.ItemBar(h,"",33) = 65280
		h = .AddItem("Task/Color+Rhombus/Color")
		.AddBar h,"Task",#1/2/2001#,#1/6/2001#
		.ItemBar(h,"",51) = 33619712
		.ItemBar(h,"",33) = 16711935
	End With
	.EndUpdate
End With
|
|
1729
|
The ItemBar(exBarColor) changes the color for margins, and there is no exBarStartColor/exBarEndColor. However in my case I would then like do dynamically change the bar color to a different color without changing the end shape color
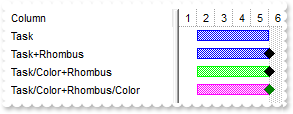
With G2antt1
	.BeginUpdate
	With .VisualAppearance
		.Add 1,"gBFLBCJwBAEHhEJAADhABXMIQAAYAQGKIYBkAKBQAGaAoDDWDoMAANAyjPBMKgBBCLAACaKQAD6CYQRhFT7yGAERr/C6EQLhGBRQCULQxDCBMIjLJoWhsASVRhnCBBR" & _
	"hwAI7ShPUBgXBNCQzICTJJkSJZBiECIJFAaJhnIapZDKGKQWCjAgiNpqGQ2QiKFC2HAcEAxCxGJBoKKZGq2bpJQLbdxUXRVZzpNi7Louay5CrOCZvXxaeAXDa+Az5ODD" & _
	"MRwLBcKhzCKDYzfdrZFaWFT3Qi8aCvG6sbw/HZ0OrEEIwCEBA"
		.Add 2,"CP:1 0 0 6 0"
	End With
	With .Chart
		.PaneWidth(False) = 164
		.FirstVisibleDate = #1/1/2001#
	End With
	.Columns.Add "Column"
	With .Items
		h = .AddItem("Task")
		.AddBar h,"Task",#1/2/2001#,#1/6/2001#
		h = .AddItem("Task+Rhombus")
		.AddBar h,"Task",#1/2/2001#,#1/6/2001#
		.ItemBar(h,"",51) = 33554432
		h = .AddItem("Task/Color+Rhombus")
		.AddBar h,"Task",#1/2/2001#,#1/6/2001#
		.ItemBar(h,"",51) = 33554432
		.ItemBar(h,"",33) = 65280
		h = .AddItem("Task/Color+Rhombus/Color")
		.AddBar h,"Task",#1/2/2001#,#1/6/2001#
		.ItemBar(h,"",51) = 33619712
		.ItemBar(h,"",33) = 16711935
	End With
	.EndUpdate
End With
|
|
1728
|
Is it possible to resize a column with the mouse without changing the width of the next column
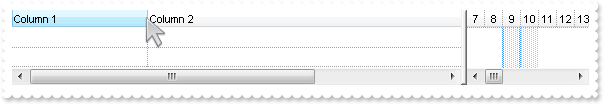
With G2antt1
	.BeginUpdate
	.ColumnAutoResize = False
	.Columns.Add("Column 1").Width = 256
	.Columns.Add("Column 2").Width = 512
	.DrawGridLines = -1
	.EndUpdate
End With
|
|
1727
|
How can I align captions of items with checkbox, with items with no checkbox
With G2antt1
	.BeginUpdate
	.Columns.Add "Default"
	With .Items
		.CellImages(.AddItem(0),0) = "1"
		.CellHasCheckBox(.AddItem(1),0) = True
		.CellImages(.AddItem(2),0) = "1"
	End With
	.EndUpdate
End With
|
|
1726
|
How can I show each group header ( not-subroup ), with a different background color, while alternate background colors for inside items
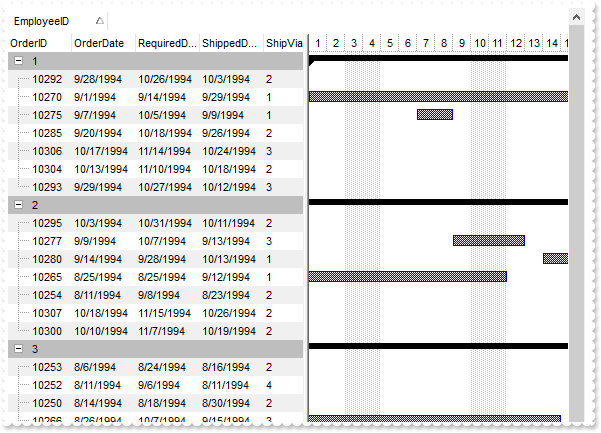
' AddGroupItem event - Occurs after a new Group Item has been inserted to Items collection.
Private Sub G2antt1_AddGroupItem(ByVal Item As Long)
	With G2antt1
		With .Items
			.AddBar Item,"Summary",.CellValue(Item,2),.CellValue(Item,4)
			.DefineSummaryBars Item,"",-3,""
		End With
	End With
End Sub

' AddItem event - Occurs after a new Item has been inserted to Items collection.
Private Sub G2antt1_AddItem(ByVal Item As Long)
	With G2antt1
		With .Items
			.AddBar Item,"Task",.CellValue(Item,2),.CellValue(Item,4)
		End With
	End With
End Sub

' LayoutChanged event - Occurs when column's position or column's size is changed.
Private Sub G2antt1_LayoutChanged()
	With G2antt1
		.Refresh
	End With
End Sub

With G2antt1
	.BeginUpdate
	.Chart.FirstVisibleDate = #9/1/1994#
	.Chart.PaneWidth(False) = 312
	.BackColorSortBar = .BackColor
	.ColumnAutoResize = False
	Set rs = CreateObject("ADOR.Recordset")
	With rs
		.Open "Orders","Provider=Microsoft.ACE.OLEDB.12.0;Data Source=C:\Program Files\Exontrol\ExG2antt\Sample\Access\misc.accdb",3,3
	End With
	.DataSource = rs
	.Items.AllowCellValueToItemBar = True
	.Columns.Item(2).Def(18) = 1
	.Columns.Item(4).Def(18) = 2
	.SortBarVisible = True
	.SortBarCaption = "Drag a <b>column</b> header here to group by that column."
	.AllowGroupBy = True
	.Columns.Item(1).SortOrder = 1
	With .Columns.Add("Position")
		.FormatColumn = "(0:= (1 rpos '')) right ( ( 1:= ( =:0 rfind `.` ) ) != -1 ? =:1 : len(=:0))"
		.Visible = False
	End With
	With .Columns.Add("Position")
		.FormatColumn = "(1 rpos '') contains '.'"
		.Visible = False
	End With
	.ConditionalFormats.Add("(%C13 mod 2) != 0").BackColor = RGB(240,240,240)
	.ConditionalFormats.Add("%C14 = 0").BackColor = RGB(190,190,190)
	.EndUpdate
End With
|
|
1725
|
What is the difference between %0 and %C0, when using in expressions ( format, conditional format, computed fields, and so on )
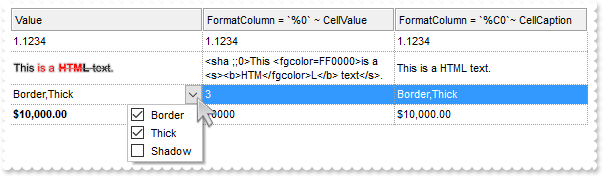
With G2antt1
	.BeginUpdate
	.Chart.PaneWidth(True) = 0
	.HeaderAppearance = 4
	.HeaderHeight = 24
	.ScrollBySingleLine = True
	.DrawGridLines = -2
	.Columns.Add("Value").Def(17) = 1
	With .Columns.Add("FormatColumn = `%0` ~ CellValue")
		.FormatColumn = "%0"
		.Def(16) = False
	End With
	With .Columns.Add("FormatColumn = `%C0`~ CellCaption")
		.FormatColumn = "%C0"
		.Def(16) = False
	End With
	With .Items
		.AddItem 1.1234
		.CellValueFormat(.AddItem("<sha ;;0>This <fgcolor=FF0000>is a <s><b>HTM</fgcolor>L</b> text</s>."),0) = 1
		With .CellEditor(.AddItem(3))
			.EditType = 6
			.AddItem 1,"Border"
			.AddItem 2,"Thick"
			.AddItem 4,"Shadow"
		End With
		.FormatCell(.AddItem(10000),0) = "`<b>` + currency(value)"
	End With
	.EndUpdate
End With
|
|
1724
|
How can I alternate colors for each group header ( not-subroup ), with a different background color, while items of the same group showing with a different color
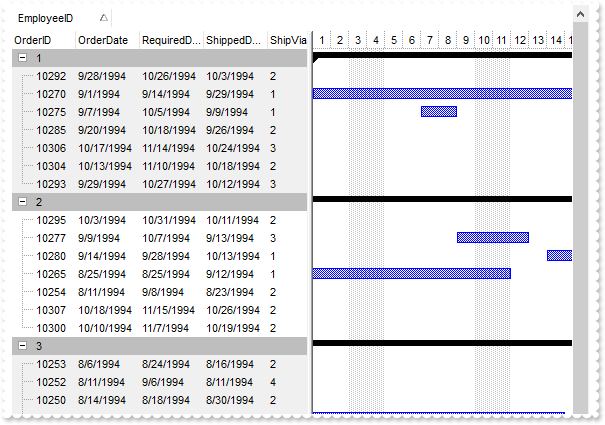
' AddGroupItem event - Occurs after a new Group Item has been inserted to Items collection.
Private Sub G2antt1_AddGroupItem(ByVal Item As Long)
	With G2antt1
		With .Items
			.AddBar Item,"Summary",.CellValue(Item,2),.CellValue(Item,4)
			.DefineSummaryBars Item,"",-3,""
		End With
	End With
End Sub

' AddItem event - Occurs after a new Item has been inserted to Items collection.
Private Sub G2antt1_AddItem(ByVal Item As Long)
	With G2antt1
		With .Items
			.AddBar Item,"Task",.CellValue(Item,2),.CellValue(Item,4)
		End With
	End With
End Sub

' LayoutChanged event - Occurs when column's position or column's size is changed.
Private Sub G2antt1_LayoutChanged()
	With G2antt1
		.Refresh
	End With
End Sub

With G2antt1
	.BeginUpdate
	.Chart.FirstVisibleDate = #9/1/1994#
	.Chart.PaneWidth(False) = 312
	.BackColorSortBar = .BackColor
	.ColumnAutoResize = False
	Set rs = CreateObject("ADOR.Recordset")
	With rs
		.Open "Orders","Provider=Microsoft.ACE.OLEDB.12.0;Data Source=C:\Program Files\Exontrol\ExG2antt\Sample\Access\misc.accdb",3,3
	End With
	.DataSource = rs
	.Items.AllowCellValueToItemBar = True
	.Columns.Item(2).Def(18) = 1
	.Columns.Item(4).Def(18) = 2
	.SortBarVisible = True
	.SortBarCaption = "Drag a <b>column</b> header here to group by that column."
	.AllowGroupBy = True
	.Columns.Item(1).SortOrder = 1
	With .Columns.Add("Position")
		.FormatColumn = "(0:= (1 rpos '')) left ( ( 1:= ( =:0 lfind `.` ) ) != -1 ? =:1 : len(=:0))"
		.Visible = False
	End With
	With .Columns.Add("Position")
		.FormatColumn = "(1 rpos '') contains '.'"
		.Visible = False
	End With
	.ConditionalFormats.Add("(%C13 mod 2) != 0").BackColor = RGB(240,240,240)
	.ConditionalFormats.Add("%C14 = 0").BackColor = RGB(190,190,190)
	.EndUpdate
End With
|
|
1723
|
How can I highlight each group header, with a different background color (method 2)
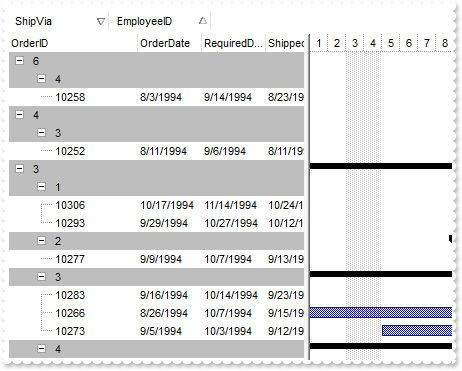
' AddGroupItem event - Occurs after a new Group Item has been inserted to Items collection.
Private Sub G2antt1_AddGroupItem(ByVal Item As Long)
	With G2antt1
		With .Items
			.ItemBackColor(Item) = RGB(190,190,190)
			.AddBar Item,"Summary",.CellValue(Item,2),.CellValue(Item,4)
			.DefineSummaryBars Item,"",-3,""
		End With
	End With
End Sub

' AddItem event - Occurs after a new Item has been inserted to Items collection.
Private Sub G2antt1_AddItem(ByVal Item As Long)
	With G2antt1
		With .Items
			.AddBar Item,"Task",.CellValue(Item,2),.CellValue(Item,4)
		End With
	End With
End Sub

' LayoutChanged event - Occurs when column's position or column's size is changed.
Private Sub G2antt1_LayoutChanged()
	With G2antt1
		.Refresh
	End With
End Sub

With G2antt1
	.BeginUpdate
	.Chart.FirstVisibleDate = #9/1/1994#
	.Chart.PaneWidth(False) = 312
	.BackColorSortBar = .BackColor
	.ColumnAutoResize = False
	Set rs = CreateObject("ADOR.Recordset")
	With rs
		.Open "Orders","Provider=Microsoft.ACE.OLEDB.12.0;Data Source=C:\Program Files\Exontrol\ExG2antt\Sample\Access\misc.accdb",3,3
	End With
	.DataSource = rs
	.Items.AllowCellValueToItemBar = True
	.Columns.Item(2).Def(18) = 1
	.Columns.Item(4).Def(18) = 2
	.SortBarVisible = True
	.SortBarCaption = "Drag a <b>column</b> header here to group by that column."
	.AllowGroupBy = True
	.Columns.Item(1).SortOrder = 1
	.EndUpdate
End With
|
|
1722
|
How can I highlight each group header ( not-subroup ), with a different background color (method 1)
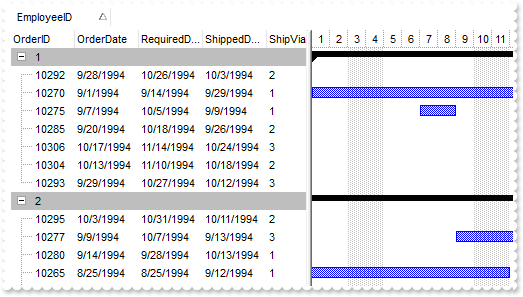
' AddGroupItem event - Occurs after a new Group Item has been inserted to Items collection.
Private Sub G2antt1_AddGroupItem(ByVal Item As Long)
	With G2antt1
		With .Items
			.AddBar Item,"Summary",.CellValue(Item,2),.CellValue(Item,4)
			.DefineSummaryBars Item,"",-3,""
		End With
	End With
End Sub

' AddItem event - Occurs after a new Item has been inserted to Items collection.
Private Sub G2antt1_AddItem(ByVal Item As Long)
	With G2antt1
		With .Items
			.AddBar Item,"Task",.CellValue(Item,2),.CellValue(Item,4)
		End With
	End With
End Sub

' LayoutChanged event - Occurs when column's position or column's size is changed.
Private Sub G2antt1_LayoutChanged()
	With G2antt1
		.Refresh
	End With
End Sub

With G2antt1
	.BeginUpdate
	.Chart.FirstVisibleDate = #9/1/1994#
	.Chart.PaneWidth(False) = 312
	.BackColorSortBar = .BackColor
	.ColumnAutoResize = False
	Set rs = CreateObject("ADOR.Recordset")
	With rs
		.Open "Orders","Provider=Microsoft.ACE.OLEDB.12.0;Data Source=C:\Program Files\Exontrol\ExG2antt\Sample\Access\misc.accdb",3,3
	End With
	.DataSource = rs
	.Items.AllowCellValueToItemBar = True
	.Columns.Item(2).Def(18) = 1
	.Columns.Item(4).Def(18) = 2
	.SortBarVisible = True
	.SortBarCaption = "Drag a <b>column</b> header here to group by that column."
	.AllowGroupBy = True
	.Columns.Item(1).SortOrder = 1
	With .Columns.Add("Position")
		.FormatColumn = "(0:= (1 rpos '')) left ( ( 1:= ( =:0 lfind `.` ) ) != -1 ? =:1 : len(=:0))"
		.Visible = False
	End With
	With .Columns.Add("Position")
		.FormatColumn = "(1 rpos '') contains '.'"
		.Visible = False
	End With
	.ConditionalFormats.Add("%C14 = 0").BackColor = RGB(190,190,190)
	.EndUpdate
End With
|
|
1721
|
The BackColorAlternate displays each second row with a different background color. Is it possible to apply a different background color, for each sub-tree, ConditionalFormats, Add
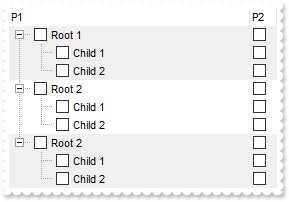
' LayoutChanged event - Occurs when column's position or column's size is changed.
Private Sub G2antt1_LayoutChanged()
	With G2antt1
		.Refresh
	End With
End Sub

' Sort event - Fired when the control sorts a column.
Private Sub G2antt1_Sort()
	With G2antt1
		.Refresh
	End With
End Sub

With G2antt1
	.BeginUpdate
	.LinesAtRoot = -1
	With .Columns.Add("P1")
		.Def(0) = True
		.PartialCheck = True
	End With
	.Chart.PaneWidth(True) = 0
	With .Columns.Add("P2")
		.Def(0) = True
		.PartialCheck = True
	End With
	With .Items
		h = .AddItem("Root 1")
		.InsertItem h,,"Child 1"
		.InsertItem h,,"Child 2"
		.ExpandItem(h) = True
		h = .AddItem("Root 2")
		.InsertItem h,,"Child 1"
		.InsertItem h,,"Child 2"
		.ExpandItem(h) = True
		h = .AddItem("Root 2")
		.InsertItem h,,"Child 1"
		.InsertItem h,,"Child 2"
		.ExpandItem(h) = True
	End With
	With .Columns.Add("Position")
		.FormatColumn = "(0:= (1 rpos '')) left ( ( 1:= ( =:0 lfind `.` ) ) != -1 ? =:1 : len(=:0))"
		.Visible = False
	End With
	.ConditionalFormats.Add("(%C2 mod 2) != 0").BackColor = RGB(240,240,240)
	.EndUpdate
End With
|
|
1720
|
The BackColorAlternate displays each second row with a different background color. Is it possible to apply a different background color, for 2nd, 3rd, 4th, row, and so on
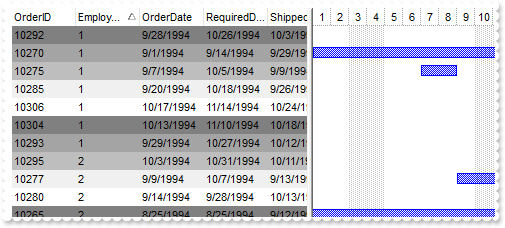
' AddItem event - Occurs after a new Item has been inserted to Items collection.
Private Sub G2antt1_AddItem(ByVal Item As Long)
	With G2antt1
		With .Items
			.AddBar Item,"Task",.CellValue(Item,2),.CellValue(Item,4)
		End With
	End With
End Sub

' LayoutChanged event - Occurs when column's position or column's size is changed.
Private Sub G2antt1_LayoutChanged()
	With G2antt1
		.Refresh
	End With
End Sub

With G2antt1
	.BeginUpdate
	.Chart.FirstVisibleDate = #9/1/1994#
	.Chart.PaneWidth(False) = 312
	.ColumnAutoResize = False
	Set rs = CreateObject("ADOR.Recordset")
	With rs
		.Open "Orders","Provider=Microsoft.ACE.OLEDB.12.0;Data Source=C:\Program Files\Exontrol\ExG2antt\Sample\Access\misc.accdb",3,3
	End With
	.DataSource = rs
	.Items.AllowCellValueToItemBar = True
	.Columns.Item(2).Def(18) = 1
	.Columns.Item(4).Def(18) = 2
	.Columns.Item(1).SortOrder = 1
	With .Columns.Add("Position")
		.FormatColumn = "1 apos ''"
		.Visible = False
	End With
	.ConditionalFormats.Add("(%C13 mod 5) = 1").BackColor = RGB(128,128,128)
	.ConditionalFormats.Add("(%C13 mod 5) = 2").BackColor = RGB(164,164,164)
	.ConditionalFormats.Add("(%C13 mod 5) = 3").BackColor = RGB(190,190,190)
	.ConditionalFormats.Add("(%C13 mod 5) = 4").BackColor = RGB(240,240,240)
	.EndUpdate
End With
|
|
1719
|
The BackColorAlternate displays each second row with a different background color. The question I have it is possible to apply a different background color for 3rd, 4th, row, and so on
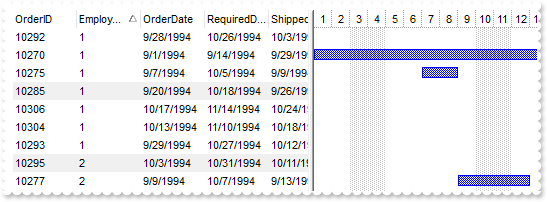
' AddItem event - Occurs after a new Item has been inserted to Items collection.
Private Sub G2antt1_AddItem(ByVal Item As Long)
	With G2antt1
		With .Items
			.AddBar Item,"Task",.CellValue(Item,2),.CellValue(Item,4)
		End With
	End With
End Sub

' LayoutChanged event - Occurs when column's position or column's size is changed.
Private Sub G2antt1_LayoutChanged()
	With G2antt1
		.Refresh
	End With
End Sub

With G2antt1
	.BeginUpdate
	.Chart.FirstVisibleDate = #9/1/1994#
	.Chart.PaneWidth(False) = 312
	.ColumnAutoResize = False
	Set rs = CreateObject("ADOR.Recordset")
	With rs
		.Open "Orders","Provider=Microsoft.ACE.OLEDB.12.0;Data Source=C:\Program Files\Exontrol\ExG2antt\Sample\Access\misc.accdb",3,3
	End With
	.DataSource = rs
	.Items.AllowCellValueToItemBar = True
	.Columns.Item(2).Def(18) = 1
	.Columns.Item(4).Def(18) = 2
	.Columns.Item(1).SortOrder = 1
	With .Columns.Add("Position")
		.FormatColumn = "1 apos ''"
		.Visible = False
	End With
	.ConditionalFormats.Add("(%C13 mod 4) = 0").BackColor = RGB(240,240,240)
	.EndUpdate
End With
|
|
1718
|
The BackColorAlternate looks fine for flat tables, but how about using it when displaying a hierarchy/tree, like grouping rows. The sample alternate colors for each group found
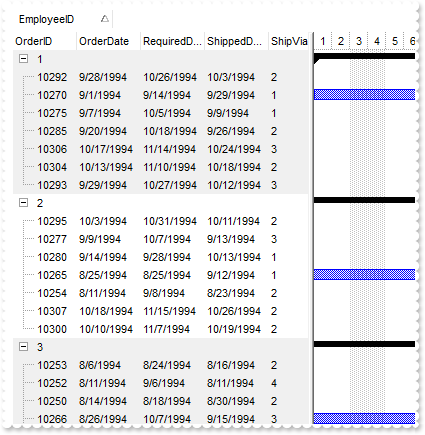
' AddGroupItem event - Occurs after a new Group Item has been inserted to Items collection.
Private Sub G2antt1_AddGroupItem(ByVal Item As Long)
	With G2antt1
		With .Items
			.AddBar Item,"Summary",.CellValue(Item,2),.CellValue(Item,4)
			.DefineSummaryBars Item,"",-3,""
		End With
	End With
End Sub

' AddItem event - Occurs after a new Item has been inserted to Items collection.
Private Sub G2antt1_AddItem(ByVal Item As Long)
	With G2antt1
		With .Items
			.AddBar Item,"Task",.CellValue(Item,2),.CellValue(Item,4)
		End With
	End With
End Sub

' LayoutChanged event - Occurs when column's position or column's size is changed.
Private Sub G2antt1_LayoutChanged()
	With G2antt1
		.Refresh
	End With
End Sub

With G2antt1
	.BeginUpdate
	.Chart.FirstVisibleDate = #9/1/1994#
	.Chart.PaneWidth(False) = 312
	.BackColorSortBar = .BackColor
	.ColumnAutoResize = False
	Set rs = CreateObject("ADOR.Recordset")
	With rs
		.Open "Orders","Provider=Microsoft.ACE.OLEDB.12.0;Data Source=C:\Program Files\Exontrol\ExG2antt\Sample\Access\misc.accdb",3,3
	End With
	.DataSource = rs
	.Items.AllowCellValueToItemBar = True
	.Columns.Item(2).Def(18) = 1
	.Columns.Item(4).Def(18) = 2
	.SortBarVisible = True
	.SortBarCaption = "Drag a <b>column</b> header here to group by that column."
	.AllowGroupBy = True
	.Columns.Item(1).SortOrder = 1
	With .Columns.Add("Position")
		.FormatColumn = "(0:= (1 rpos '')) left ( ( 1:= ( =:0 lfind `.` ) ) != -1 ? =:1 : len(=:0))"
		.Visible = False
	End With
	.ConditionalFormats.Add("(%C13 mod 2) != 0").BackColor = RGB(240,240,240)
	.EndUpdate
End With
|
|
1717
|
How do I show the chart's labels in 24-hour clock format
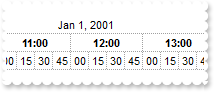
With G2antt1
	With .Chart
		.PaneWidth(False) = 0
		.FirstVisibleDate = #1/1/2001#
		.LevelCount = 3
		With .Level(0)
			.Label = "<%mmm%> <%d%>, <%yyyy%>"
			.Alignment = 17 ' AlignmentEnum.exHOutside Or AlignmentEnum.CenterAlignment
			.Unit = 4096
		End With
		With .Level(1)
			.Label = "<b><%h%>:00</b>"
			.Alignment = 1
			.Unit = 65536
			.DrawTickLines = True
			.DrawGridLines = True
		End With
		With .Level(2)
			.Label = "<%nn%>"
			.Unit = 1048576
			.Count = 15
		End With
		.ScrollTo #1/1/2001 8:30:00 AM#,0
	End With
End With
|
|
1716
|
How do I show the chart's labels in 12-hour clock format
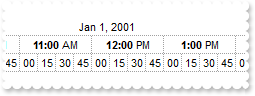
With G2antt1
	With .Chart
		.PaneWidth(False) = 0
		.FirstVisibleDate = #1/1/2001#
		.LevelCount = 3
		With .Level(0)
			.Label = "<%mmm%> <%d%>, <%yyyy%>"
			.Alignment = 17 ' AlignmentEnum.exHOutside Or AlignmentEnum.CenterAlignment
			.Unit = 4096
		End With
		With .Level(1)
			.Label = "<b><%h%>:00</b> <%AM/PM%>"
			.Alignment = 1
			.Unit = 65536
			.DrawTickLines = True
			.DrawGridLines = True
		End With
		With .Level(2)
			.Label = "<%nn%>"
			.Unit = 1048576
			.Count = 15
		End With
		.ScrollTo #1/1/2001 8:30:00 AM#,0
	End With
End With
|
|
1715
|
I would like to avoid manual typing in the date-cell because user often type wrong things (no decimal points and so on) and so the todays-date is generated for the cell. What can be done
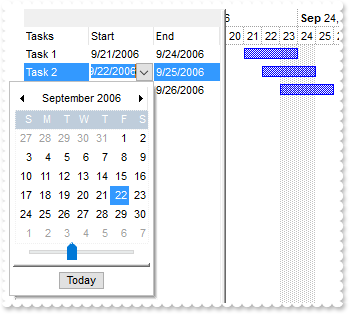
' KeyPress event - Occurs when the user presses and releases an ANSI key.
Private Sub G2antt1_KeyPress(KeyAscii As Integer)
	With G2antt1
		Debug.Print( "if .Editying != 0 then" )
		Debug.Print( .Editing )
		KeyAscii = 0
	End With
End Sub

With G2antt1
	.BeginUpdate
	With .Columns
		.Add "Tasks"
		With .Add("Start")
			.Def(18) = 1
			.Editor.EditType = 7
		End With
		With .Add("End")
			.Def(18) = 2
			.Editor.EditType = 7
		End With
	End With
	With .Chart
		.FirstVisibleDate = #9/20/2006#
		.AllowLinkBars = True
		.AllowCreateBar = 0
		.LevelCount = 2
		.PaneWidth(0) = 196
	End With
	With .Items
		.AllowCellValueToItemBar = True
		.AddBar .AddItem("Task 1"),"Task",#9/21/2006#,#9/24/2006#
		.AddBar .AddItem("Task 2"),"Task",#9/22/2006#,#9/25/2006#
		.AddBar .AddItem("Task 3"),"Task",#9/23/2006#,#9/26/2006#
	End With
	.EndUpdate
End With
|
|
1714
|
When a Day, Week etc is clicked how can we make it centre/zoom the chart to cover all the bars
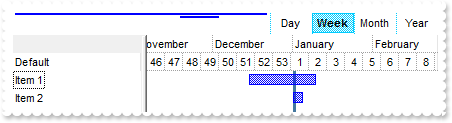
' OverviewZoom event - Occurs once the user selects a new time scale unit in the overview zoom area.
Private Sub G2antt1_OverviewZoom()
	With G2antt1
		With .Chart
			.ScrollTo #1/1/2001#,1
			Debug.Print( "Start" )
			Debug.Print( .StartPrintDate )
			Debug.Print( "End" )
			Debug.Print( .EndPrintDate )
		End With
	End With
End Sub

With G2antt1
	.BeginUpdate
	With .Chart
		.PaneWidth(False) = 128
		.LevelCount = 2
		.OverviewVisible = 2
		.AllowOverviewZoom = 1
		.Label(16777216) = ""
		.Label(1048576) = ""
		.Label(65536) = ""
		.UnitScale = 4096
		.ScrollTo #1/1/2001#,1
		.MarkTimeZone "zone",#1/1/2001#,#1/2/2001#,10516548
	End With
	.Columns.Add "Default"
	With .Items
		.AddBar .AddItem("Item 1"),"Task",#12/15/2000#,#1/10/2001#
		.AddBar .AddItem("Item 2"),"Task",#1/1/2001#,#1/5/2001#
	End With
	.EndUpdate
End With
|
|
1713
|
The first time we run the application, the day label headers looks different then pressing Week and then Day again on the control's overview part. How do we make to show the header in the same format
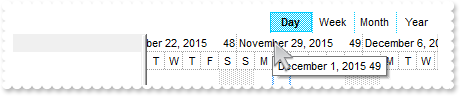
With G2antt1
	With .Chart
		.PaneWidth(False) = 128
		.LevelCount = 2
		.OverviewVisible = 2
		.AllowOverviewZoom = 1
		.Label(16777216) = ""
		.Label(1048576) = ""
		.Label(65536) = ""
		.UnitScale = 4096
	End With
End With
|
|
1712
|
How to sort numerically by columns
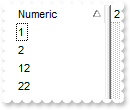
With G2antt1
	.BeginUpdate
	.Columns.Add("Numeric").SortType = 1
	With .Items
		.AddItem 1
		.AddItem 2
		.AddItem 12
		.AddItem 22
	End With
	.Columns.Item(0).SortOrder = 1
	.EndUpdate
End With
|
|
1711
|
The control does not ensure the item to fit the control's client area once the user clicks the cell's button or check box. What can be done
' MouseDown event - Occurs when the user presses a mouse button.
Private Sub G2antt1_MouseDown(ByVal Button As Integer, ByVal Shift As Integer, ByVal X As Long, ByVal Y As Long)
	' Items.EnsureVisibleItem(ItemFromPoint(-1,-1,c,hit))
End Sub

With G2antt1
	.BeginUpdate
	.TreeColumnIndex = -1
	.SelForeColor = .ForeColor
	With .Columns.Add("Buttons")
		.Alignment = 1
		.Def(2) = True
	End With
	With .Items
		.AddItem "Button A"
		.AddItem "Button B"
		.AddItem "Button C"
	End With
	.EndUpdate
End With
|
|
1710
|
How do I arrange the levels when the user changes the scale using the control's overview part
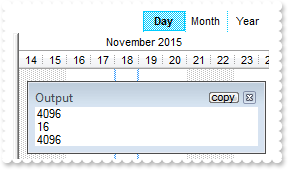
' OverviewZoom event - Occurs once the user selects a new time scale unit in the overview zoom area.
Private Sub G2antt1_OverviewZoom()
	With G2antt1
		Debug.Print( .Chart.UnitScale )
		.EnsureVisibleColumn 0
		With .Chart
			.Level(0).DrawTickLines = 0
			.ScrollTo #11/18/2015#,1
		End With
	End With
End Sub

With G2antt1
	.BeginUpdate
	With .Chart
		.FirstVisibleDate = #11/18/2015#
		.PaneWidth(False) = 0
		.LevelCount = 2
		.DrawLevelSeparator = 2
		With .Level(0)
			.Alignment = 17 ' AlignmentEnum.exHOutside Or AlignmentEnum.CenterAlignment
			.DrawTickLines = 2
			.BackColor = G2antt1.BackColor
		End With
		With .Level(1)
			.DrawTickLines = 65 ' LevelLineEnum.exLevelMiddleLine Or LevelLineEnum.exLevelDotLine
			.DrawTickLinesFrom 0,2
		End With
		.OverviewVisible = 2
		.AllowOverviewZoom = 1
		.UnitWidth = 24
		.Label(16777216) = ""
		.Label(1048576) = ""
		.Label(65536) = ""
		.Label(256) = ""
		.Label(4096) = "<|><%d%><|><%d3%>, <%m3%> <%d%>, '<%yy%><|><%dddd%>, <%mmmm%> <%d%>, <%yyyy%><||><||>4096"
		.UnitScale = 4096
		.ScrollTo .FirstVisibleDate,1
	End With
	.Columns.Add "Default"
	.EndUpdate
End With
|
|
1709
|
I am using AllowGroupBy, the question is it is possible to add summary bars for child item, when user do grouping
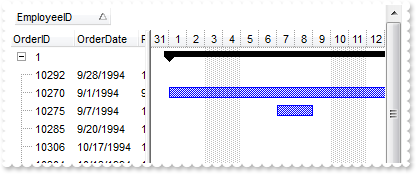
' AddGroupItem event - Occurs after a new Group Item has been inserted to Items collection.
Private Sub G2antt1_AddGroupItem(ByVal Item As Long)
	With G2antt1
		With .Items
			.AddBar Item,"Summary",.CellValue(Item,2),.CellValue(Item,4)
			.DefineSummaryBars Item,"",-3,""
		End With
	End With
End Sub

' AddItem event - Occurs after a new Item has been inserted to Items collection.
Private Sub G2antt1_AddItem(ByVal Item As Long)
	With G2antt1
		With .Items
			.AddBar Item,"Task",.CellValue(Item,2),.CellValue(Item,4)
		End With
	End With
End Sub

With G2antt1
	.BeginUpdate
	.Chart.FirstVisibleDate = #9/1/1994#
	.BackColorSortBar = .BackColor
	.ColumnAutoResize = False
	Set rs = CreateObject("ADOR.Recordset")
	With rs
		.Open "Orders","Provider=Microsoft.ACE.OLEDB.12.0;Data Source=C:\Program Files\Exontrol\ExG2antt\Sample\Access\misc.accdb",3,3
	End With
	.DataSource = rs
	.SortBarVisible = True
	.SortBarCaption = "Drag a <b>column</b> header here to group by that column."
	.AllowGroupBy = True
	.Columns.Item(1).SortOrder = 1
	.EndUpdate
End With
|
|
1708
|
I noticed that when grouping on a field, its details are always expanded. Is it possible to show collapsed by default (method 3)
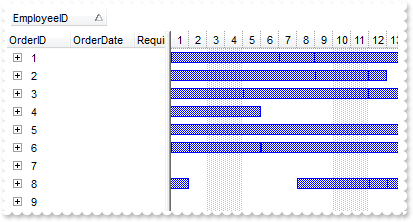
' AddItem event - Occurs after a new Item has been inserted to Items collection.
Private Sub G2antt1_AddItem(ByVal Item As Long)
	With G2antt1
		With .Items
			.AddBar Item,"Task",.CellValue(Item,2),.CellValue(Item,4)
		End With
	End With
End Sub

With G2antt1
	.BeginUpdate
	.Chart.FirstVisibleDate = #9/1/1994#
	.BackColorSortBar = .BackColor
	.ColumnAutoResize = False
	Set rs = CreateObject("ADOR.Recordset")
	With rs
		.Open "Orders","Provider=Microsoft.ACE.OLEDB.12.0;Data Source=C:\Program Files\Exontrol\ExG2antt\Sample\Access\misc.accdb",3,3
	End With
	.DataSource = rs
	.SortBarVisible = True
	.SortBarCaption = "Drag a <b>column</b> header here to group by that column."
	.AllowGroupBy = True
	.Chart.ShowCollapsedBars = True
	.EndUpdate
	.Layout = "multiplesort=""C1:1"";collapse=""0-9999"""
End With
|
|
1707
|
I noticed that when grouping on a field, its details are always expanded. Is it possible to show collapsed by default (method 2)
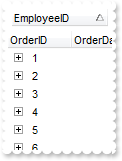
' AddItem event - Occurs after a new Item has been inserted to Items collection.
Private Sub G2antt1_AddItem(ByVal Item As Long)
	With G2antt1
		With .Items
			.AddBar Item,"Task",.CellValue(Item,2),.CellValue(Item,4)
		End With
	End With
End Sub

With G2antt1
	.BeginUpdate
	.Chart.FirstVisibleDate = #9/1/1994#
	.BackColorSortBar = .BackColor
	.ColumnAutoResize = False
	Set rs = CreateObject("ADOR.Recordset")
	With rs
		.Open "Orders","Provider=Microsoft.ACE.OLEDB.12.0;Data Source=C:\Program Files\Exontrol\ExG2antt\Sample\Access\misc.accdb",3,3
	End With
	.DataSource = rs
	.SortBarVisible = True
	.SortBarCaption = "Drag a <b>column</b> header here to group by that column."
	.AllowGroupBy = True
	.Columns.Item(1).SortOrder = 1
	.EndUpdate
	.BeginUpdate
	.EnsureVisibleColumn 0
	.Items.ExpandItem(0) = False
	.EndUpdate
End With
|
|
1706
|
I noticed that when grouping on a field, its details are always expanded. Is it possible to show collapsed by default (method 1)
' AddGroupItem event - Occurs after a new Group Item has been inserted to Items collection.
Private Sub G2antt1_AddGroupItem(ByVal Item As Long)
	With G2antt1
		.Items.ExpandItem(Item) = False
	End With
End Sub

' AddItem event - Occurs after a new Item has been inserted to Items collection.
Private Sub G2antt1_AddItem(ByVal Item As Long)
	With G2antt1
		With .Items
			.AddBar Item,"Task",.CellValue(Item,2),.CellValue(Item,4)
		End With
	End With
End Sub

With G2antt1
	.BeginUpdate
	.Chart.FirstVisibleDate = #9/1/1994#
	.BackColorSortBar = .BackColor
	.ColumnAutoResize = False
	Set rs = CreateObject("ADOR.Recordset")
	With rs
		.Open "Orders","Provider=Microsoft.ACE.OLEDB.12.0;Data Source=C:\Program Files\Exontrol\ExG2antt\Sample\Access\misc.accdb",3,3
	End With
	.DataSource = rs
	.SortBarVisible = True
	.SortBarCaption = "Drag a <b>column</b> header here to group by that column."
	.AllowGroupBy = True
	.Columns.Item(1).SortOrder = 1
	.EndUpdate
End With
|
|
1705
|
Is there a possibility to expand / collapse all groups (or group by group) at runtime with a method (equivalent to pressing the + or - button in the group header)
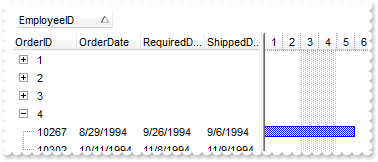
' AddItem event - Occurs after a new Item has been inserted to Items collection.
Private Sub G2antt1_AddItem(ByVal Item As Long)
	With G2antt1
		With .Items
			.AddBar Item,"Task",.CellValue(Item,2),.CellValue(Item,4)
		End With
	End With
End Sub

With G2antt1
	.BeginUpdate
	.Chart.FirstVisibleDate = #9/1/1994#
	.BackColorSortBar = .BackColor
	.ColumnAutoResize = False
	Set rs = CreateObject("ADOR.Recordset")
	With rs
		.Open "Orders","Provider=Microsoft.ACE.OLEDB.12.0;Data Source=C:\Program Files\Exontrol\ExG2antt\Sample\Access\misc.accdb",3,3
	End With
	.DataSource = rs
	.SortBarVisible = True
	.SortBarCaption = "Drag a <b>column</b> header here to group by that column."
	.AllowGroupBy = True
	.Columns.Item(1).SortOrder = 1
	.EndUpdate
	.EnsureVisibleColumn 0
	.BeginUpdate
	With .Items
		.ExpandItem(.RootItem(0)) = False
		.ExpandItem(.RootItem(1)) = False
		.ExpandItem(.RootItem(2)) = False
	End With
	.EndUpdate
End With
|
|
1704
|
Is there a possibility to expand / collapse all groups (or group by group) at runtime with a method (equivalent to pressing the + or - button in the group header)
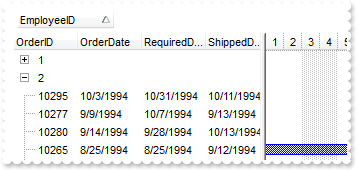
' AddItem event - Occurs after a new Item has been inserted to Items collection.
Private Sub G2antt1_AddItem(ByVal Item As Long)
	With G2antt1
		With .Items
			.AddBar Item,"Task",.CellValue(Item,2),.CellValue(Item,4)
		End With
	End With
End Sub

With G2antt1
	.BeginUpdate
	.Chart.FirstVisibleDate = #9/1/1994#
	.BackColorSortBar = .BackColor
	.ColumnAutoResize = False
	Set rs = CreateObject("ADOR.Recordset")
	With rs
		.Open "Orders","Provider=Microsoft.ACE.OLEDB.12.0;Data Source=C:\Program Files\Exontrol\ExG2antt\Sample\Access\misc.accdb",3,3
	End With
	.DataSource = rs
	.SortBarVisible = True
	.SortBarCaption = "Drag a <b>column</b> header here to group by that column."
	.AllowGroupBy = True
	.Columns.Item(1).SortOrder = 1
	.EndUpdate
	.BeginUpdate
	.EnsureVisibleColumn 0
	With .Items
		.ExpandItem(.FirstVisibleItem) = False
	End With
	.EndUpdate
End With
|
|
1703
|
How can I move automatically a bar once another is moved ( non-working bars )
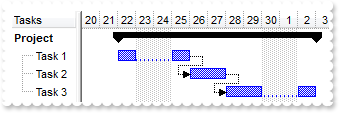
With G2antt1
	.BeginUpdate
	.MarkSearchColumn = False
	.OnResizeControl = 1
	.Columns.Add "Tasks"
	.Columns.Add("Start").Visible = False
	.Columns.Add("End").Visible = False
	With .Chart
		.FirstVisibleDate = #9/20/2006#
		.PaneWidth(0) = 64
		With .Bars.Add("Task:Split")
			.Shortcut = "TSplit"
			.Def(20) = True
		End With
	End With
	With .Items
		h = .AddItem("Project")
		.CellValue(h,1) = #9/22/2006#
		.CellValue(h,2) = #10/3/2006#
		.AddBar h,"Summary",.CellValue(h,1),.CellValue(h,2)
		h1 = .InsertItem(h,,"Task 1")
		.CellValue(h1,1) = .CellValue(h,1)
		.CellValue(h1,2) = #9/26/2006#
		.AddBar h1,"TSplit",.CellValue(h1,1),.CellValue(h1,2)
		h2 = .InsertItem(h,,"Task 2")
		.CellValue(h2,1) = .CellValue(h1,2)
		.CellValue(h2,2) = #9/28/2006#
		.AddBar h2,"TSplit",.CellValue(h2,1),.CellValue(h2,2)
		.AddLink "L1",h1,"",h2,""
		h3 = .InsertItem(h,,"Task 3")
		.CellValue(h3,1) = .CellValue(h2,2)
		.CellValue(h3,2) = .CellValue(h,2)
		.AddBar h3,"TSplit",.CellValue(h3,1),.CellValue(h3,2)
		.AddLink "L2",h2,"",h3,""
		.GroupBars h1,"",False,h2,"",True,7
		.GroupBars h2,"",False,h3,"",True,7
		.DefineSummaryBars h,"",h1,""
		.DefineSummaryBars h,"",h2,""
		.DefineSummaryBars h,"",h3,""
		.ExpandItem(h) = True
		.ItemBold(h) = True
	End With
	.EndUpdate
End With
|
|
1702
|
How can I get notified once the user expands a column
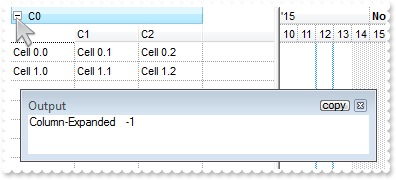
' LayoutChanged event - Occurs when column's position or column's size is changed.
Private Sub G2antt1_LayoutChanged()
	With G2antt1
		Debug.Print( "Column-Expanded" )
		Debug.Print( .Columns.Item("C0").Expanded )
	End With
End Sub

With G2antt1
	.BeginUpdate
	.ShowFocusRect = False
	.ColumnAutoResize = False
	.DrawGridLines = -1
	.BackColorLevelHeader = .BackColor
	With .Columns
		With .Add("C0")
			.ExpandColumns = "0,1,2"
			.DisplayExpandButton = True
		End With
		.Add "C1"
		.Add "C2"
	End With
	With .Items
		h = .AddItem("Cell 0.0")
		.CellValue(h,1) = "Cell 0.1"
		.CellValue(h,2) = "Cell 0.2"
		h = .AddItem("Cell 1.0")
		.CellValue(h,1) = "Cell 1.1"
		.CellValue(h,2) = "Cell 1.2"
	End With
	.EndUpdate
End With
|
|
1701
|
I am using expandable headers, the question is how I can display the column itself, not just the child columns
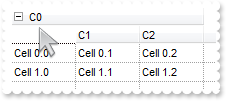
With G2antt1
	.BeginUpdate
	.ColumnAutoResize = False
	.DrawGridLines = -1
	.BackColorLevelHeader = .BackColor
	With .Columns
		With .Add("C0")
			.ExpandColumns = "0,1,2"
			.DisplayExpandButton = True
		End With
		.Add "C1"
		.Add "C2"
	End With
	With .Items
		h = .AddItem("Cell 0.0")
		.CellValue(h,1) = "Cell 0.1"
		.CellValue(h,2) = "Cell 0.2"
		h = .AddItem("Cell 1.0")
		.CellValue(h,1) = "Cell 1.1"
		.CellValue(h,2) = "Cell 1.2"
	End With
	.EndUpdate
End With
|